Android SDK Documentation
Android SDK - v2.8.x
Current Version
Released November 2018
Version 2.8.2 is the current stable release.
New Features in version 2.8.2
- Added configuration options for gridlines (see Programming Notes)
- Improved performance of floating X-Axis legend during pan and zoom
- Symbol search in sample app now uses Predictive API to show matches of company name or symbol
Bug Fixes
- Fixed loading spinner so it continues after rotation if data load is still in progress
- Changed the default color of Fibonacci Retracement 0% and 100% lines from white to gray
- Fixed number formatting of crosshairs data when viewing the On Balance Volume indicator
- Fixed a race condition that could cause incorrect chart size after rotation
- Corrected the time frame for YTD charts in the sample app
- Improved number formatting for the Latest Price indicator
- Fixed issues that occurred when panning after a Ray or Extended Line drawing was added
- Removed the chart resizing gripper when there's no lower indicator in single lower chart mode
- Retained user-modified chart size percentage on rotation
Programming Notes
New options for configuration of gridlines
Chart gridlines may be enabled, disabled or modified via XML configuration files. The following options are now available (defaults in parentheses):
- majorGridLinesDashedUpper (true) -- set false for solid gridlines in upper charts
- majorGridLinesDashedLower (true) -- set false for solid gridlines in lower charts
- showXAxisMajorGridLinesUpper (false) -- vertical gridlines for upper charts
- showXAxisMajorGridLinesLower (false) -- vertical gridlines for lower charts
- showYAxisMajorGridLinesUpper (true) -- horizontal gridlines for upper charts
- showYAxisMajorGridLinesLower (true) -- horizontal gridlines for lower charts
- widthMajorGridLinesDashedUpper (3.0) -- dash/space pattern width (dp) for upper charts
- widthMajorGridLinesDashedLower (3.0) -- dash/space pattern width (dp) for lower charts
- thicknessMajorGridLinesUpper (1.0) -- line thickness (dp) for upper charts
- thicknessMajorGridLinesLower (1.0) -- line thickness (dp) for lower charts
- colorUpperMajorGridStyleLine (#C8C9CAAA or #7C878EAA) -- upper chart gridline color (#RRGGBBAA) for light or dark theme
- colorLowerMajorGridStyleLine (#C8C9CAAA or #7C878EAA) -- lower chart gridline color (#RRGGBBAA) for light or dark theme
Default values for all configuration options are shown in files in the Documentation folder of the release package.
Please refer to the Change Log below for programming notes related to the earlier releases.
Introduction
In general terms an SDK is a reusable software platform used to develop applications, products and solutions. SDKs contain examples, documentation, code libraries and application programming interfaces (APIs) that bring together all the different components that enable development of a project or solution. Chartworks is Communify's Android SDK that allows developers to easily add and customize interactive pinch and zoom financial charting into a new or existing Android applications.
Authentication
In the sample application and examples below we will be using demo-token as our demo authentication token.
This token is passed to the ChartDataRequest setToken() method. Details on how to generate a real authentication token can be found
in the Authentication section.
Our demo-token is only entitled for delayed data for the following securities:
- Apple Inc (symbol: AAPL) trading on the NASDAQ
- Microsoft (symbol: MSFT) trading on the NASDAQ
Requests to chart any other securities will fail.
Requirements
Device OS:
- Android 4.0+ (minSdkVersion 14) required
- Android 5.0+ recommended
Device Support:
- Flagship Android mobile devices released within the last 4 years
Development Environment:
- Android Studio 3.0+ on Windows, Mac or Linux
Package Contents
Chartworks consists of the following files:
- SampleProject (an example application showing the use of Chartworks SDK)
- ChartWorks-v[current version].apk (Compiled SampleProject application)
- Documentation folder containing Getting Started, Release Notes, and Javadocs
- markitcharts-[current version].aar (Chartworks framework)
- shinobicontrols-android-charts-premium-java-1.9.4-0.aar
- shinobicontrols-android-charts-premium-java-1.9.4-0.pom
Frameworks
To integrate Chartworks the following frameworks must be included in your application.
Adding Chartworks Framework
Add these to your project's lib folder:
- markitcharts-[current version].aar For example: (markitcharts-2.7.1.aar)
- shinobicontrols-android-charts-premium-java-1.9.4-0.aar
- shinobicontrols-android-charts-premium-java-1.9.4-0.pom
Dependencies
Below are the listed dependencies used in the SDK:
Android Imports
import markit.android.ChartViewIndicatorListener;
import markit.android.DataObjects.ChartDataRequest;
import markit.android.DataObjects.ChartStyle;
import markit.android.DataObjects.DrawingMode;
import markit.android.DataObjects.Error;
import markit.android.DataObjects.Frequency;
import markit.android.DataObjects.Indicator;
import markit.android.DataObjects.LowerIndicator;
import markit.android.DataObjects.MenuChoice;
import markit.android.DataObjects.ReturnsData;
import markit.android.DataObjects.TimeFrame;
import markit.android.DataObjects.UpperIndicator;
import markit.android.Interfaces.ChartHandler;
import markit.android.Interfaces.ChartUpdates;
import markit.android.MenuCleaner;
Note: You may not use all imports but above is listed as imports used to construct what is visible in the sample app.
Gradle Dependencies
Open build.gradle file in your application and add the following dependencies:
dependencies {
    compile fileTree(include: ['*.jar'], dir: 'libs')
    compile(name: 'markitcharts-[current version]', ext: 'aar')
}

repositories{
    flatDir{
        dirs 'libs'
    }
}
Third Party Dependencies
The Chartworks SDK uses Jackson for deserializing data into objects, so by including the MarkitChart SDK you will already have the dependency included. You may have to remove references to Jackson if you are already using it.
At this time, we are using the following verisons of Jackson:
- com.fasterxml.jackson.core:jackson-databind:2.8.1
- com.fasterxml.jackson.core:jackson-core:2.8.1
- com.fasterxml.jackson.core:jackson-annotations:2.8.1
ShinobiControls is used for graphics:
- shinobicontrols-android-charts-premium-java-1.9.4-0
ProGuard
The SampleApplication includes a proguard-rules.pro file which contains rules to incorporate in your app's rules file.
Quick Start
Example Code
Adding Chartworks
The SDK implements methods from the ChartHandler interface, including a Builder class which is used to provide programmable configuration of the charts. In the example below, the builder is used to define a chart with one upper and four lower indicators.
public class MainActivity extends FragmentActivity implements ChartUpdates, ChartViewIndicatorListener {

private boolean showDarkTheme = true;
    @Override
    protected void onCreate(Bundle savedInstanceState) {
         super.onCreate(savedInstanceState);
         setContentView(R.layout.activity_main);
           chartHandler = new ChartHandler.Builder(R.id.chart)
                    // Set base theme
                    .showDarkTheme(true)

                    // Set ChartView Listeners
                    .setChartViewIndicatorListener(this)

                    // Automatically hide or show the Lowerchart when all the lower indicators are removed.
                    .hideLowerChartAutomatically(false) // false or true

                    // Show or Hide the +Indicators Button (OPTIONAL)
                    .showIndicatorButton(true)

                    // Add Upper Indicators
                    .addUpperIndicator(UpperIndicator.SMA1_SimpleMovingAverage_1, true)

                    // Add Lower Indicators
                    .addLowerIndicator(LowerIndicator.ChaikinsVolatility, true)
                    .addLowerIndicator(LowerIndicator.WilliamsPercentR, true)
                    .addLowerIndicator(LowerIndicator.MACD_MovingAverageConvergenceDivergence, true)
                    .addLowerIndicator(LowerIndicator.Volume,true,true)

                    // optionally set the log level (default: None)
                    .setLogLevel(ChartHandler.LogLevel.Info)

                    // set the override xml file
                    .setConfigIds(R.raw.chartworks_dark_theme)

                    // load override xml and build the chart fragment
                    .build(getSupportFragmentManager());
    }
}
- ChartHandler is the interface for manipulating the Chartworks SDK's properties.
- R.id.chart is your reference to what container layout you want to be replaced with the chart fragment.
- showDarkTheme is a boolean representing which base theme should be enabled (true is dark theme, false is light theme).
- setChartViewIndicatorListener is your callback listener to know when an indicator was removed or when the Plus Indicator button was tapped.
- addUpperIndicator This adds an upper indicator.
addUpperIndicator(UpperIndicator upperIndicator, boolean active) - Adds an upper indicator.
- upperIndicator - An Enum of for UpperIndicator. (see UpperIndicators Enum Below)
- active - Must be true (usage of false for inactive indicators has been deprecated)
Upper Indicators
UpperIndicator.AccumulationDistrutionLine
UpperIndicator.BollingerBands
UpperIndicator.PriceChannel
UpperIndicator.LinearRegression
UpperIndicator.PSAR_ParabolicStopAndReverse
UpperIndicator.TSF_TimeSeriesForecast
UpperIndicator.MAE_MovingAverageEnvelope
UpperIndicator.SMA1_SimpleMovingAverage_1
UpperIndicator.SMA2_SimpleMovingAverage_2
UpperIndicator.SMA3_SimpleMovingAverage_3
UpperIndicator.EMA1_ExponentialMovingAverage1
UpperIndicator.EMA2_ExponentialMovingAverage2
UpperIndicator.EMA3_ExponentialMovingAverage3
UpperIndicator.WMA1_WeightedMovingAverage1
UpperIndicator.WMA2_WeightedMovingAverage2
UpperIndicator.WMA3_WeightedMovingAverage3
UpperIndicator.LatestPrice
UpperIndicator.Dividends
UpperIndicator.Earnings
UpperIndicator.Splits
UpperIndicator.PeriodHighAndLow
UpperIndicator.Price
- addLowerIndicator This adds a lower indicator as your available preloaded indicators for your request and there are additional options
addLowerIndicator(LowerIndicator lowerIndicator, boolean active) - lowerIndicator - An Enum of for UpperIndicator. (see LowerIndicator Enum Below)
- active - Must be true (usage of false for inactive indicators has been deprecated)
addLowerIndicator(LowerIndicator lowerIndicator, boolean active, boolean selected) - lowerIndicator - An Enum of for UpperIndicator. (see LowerIndicator Enum Below)
- active - Must be true (usage of false for inactive indicators has been deprecated)
- selected - Used to determine if the indicator should be selected and drawn. If there is only one lower chart, only 1 lower indicator can be drawn at a time, while multiple can be active and selectable.
Lower Indicators
LowerIndicator.Revenues
LowerIndicator.DividendYield
LowerIndicator.RollingDividend
LowerIndicator.PERange
LowerIndicator.PERatio
LowerIndicator.RollingEPS
LowerIndicator.MassIndex
LowerIndicator.Momentum
LowerIndicator.PriceRateOfChange
LowerIndicator.FastStochastics
LowerIndicator.SlowStochastics
LowerIndicator.UltimateOscillator
LowerIndicator.ChaikinsVolatility
LowerIndicator.WilliamsPercentR
LowerIndicator.MACD_MovingAverageConvergenceDivergence
LowerIndicator.RSI_RelativeStrengthIndex
LowerIndicator.AverageTrueRange
LowerIndicator.DMI_DirectionalMovementIndex
LowerIndicator.DMI_ADX_DirectionalMovementIndex
LowerIndicator.DMI_ADXR_DirectionalMovementIndex
LowerIndicator.Volume
LowerIndicator.UpDown
LowerIndicator.OnBalanceVolume
LowerIndicator.VROC_VolumeRateOfChange
LowerIndicator.MoneyFlowIndex
LowerIndicator.MoneyFlow
LowerIndicator.AwesomeOscillator
LowerIndicator.BBandPercentB
LowerIndicator.BBandsWidth
Using Indicators after initialization
- At any time you want to add an indicator to a chart you can do so by calling the charthandler.
setUpperIndicatorIsActive(UpperIndicator upperIndicatorKey, boolean isActive);
- Using the enum list you can say pass the indicator you want to draw and whether it is drawn or not by passing true or false to isActive.
setLowerIndicatorIsActive(LowerIndicator lowerIndicatorKey, boolean isActive);
setLowerIndicatorIsSelected(LowerIndicator lowerIndicatorKey, boolean isSelected);
- Using the enum list you can say pass the indicator you want to draw and whether it is drawn or not by passing true or false to selected and whether or not it is visible on the legend by using the isActive method.
- if something IsSelected it is automatically isActive you only need to use isActive if you want something to show in the legend but is not currently drawn on the lower chart.
Comparisons
At any time you can call the chartHandler to add or remove a comparison symbol.
chartHandler.addComparer(String symbol, String issueId);
- symbol - the symbol shown in the legend
- issueId - A valid Communify Issue Id. for example: (205778 = Microsoft )
To remove a comparison call removeComparer
chartHandler.removeComparer(String issueId);
- issueId - the issueId previously passed to addComparer
Getting Chart Data
A demo chart data API URL is specified in the SDK and sample app. It supports only two symbols: AAPL and MSFT.
If you're not using Ping authentication, to access production chart data specify the production chart data API URL in a string named "chart_api" in the strings.xml file of your app. Please obtain the appropriate URL from your Markit project manager or technical contact.
For Ping authentication, the token is sent to the API in the request header. After obtaining the token, make the following call:
ChartDataRequest.setToken(token);
The header information can then be obtaining with the following call:
ArrayMap<String,String> headers = ChartDataRequest.getApiHeaders();
The example below, from MainActivity.java in the sample app, is based on the Volley network library. Note the override of getHeaders(), which puts the token into the network header. The error handling method, onErrorResponse(), gets a fresh token and retries the request.
    private String demoToken = "demo-token";

    private void getChartData(){
        if (chartHandler != null && issueId != null) {
            chartHandler.setMainIssueID(issueId);
            JsonObjectRequest jsonObjectRequest = getChartDataJSON();
            AppController.getInstance().addToRequestQueue(jsonObjectRequest, VOLLEY_TAG);
            responsePending = true;
        } else {
            Alerts.showAlert(MainActivity.this, getString(R.string.chart_data_error), getString(R.string.issue_id));
        }
    }

    private JsonObjectRequest getChartDataJSON(){
        ChartDataRequest chartDataRequest = chartHandler.getChartDataRequest();
        if(realtime){
            chartDataRequest.setRealTime(realtime);
        }

        if (quote != null) {
            chartDataRequest.setDisplaySymbol(quote.getSymbol());
        } else if (quoteSymbol != null) {
            chartDataRequest.setDisplaySymbol(quoteSymbol.toUpperCase());
        }
        JSONObject request = chartDataRequest.getJSONObject();
        String seriesApiUrl;
        if(seriesApi == null){
            seriesApiUrl = ChartDataRequest.getAPIUrl(getApplicationContext());
        } else  {
            seriesApiUrl = seriesApi;
        }

        return new JsonObjectRequest(seriesApiUrl, request, new Response.Listener<JSONObject>() {
            @Override
            public void onResponse(JSONObject jsonObject) {
                long end = System.currentTimeMillis();
                responsePending = false;
                resetInvalidTokenCount();
                chartHandler.drawCharts(jsonObject);
            }
        }, new Response.ErrorListener() {
            @Override
            public void onErrorResponse(VolleyError volleyError) {
                String message = "";
                hideLoading();

                responsePending = false;
                if (volleyError instanceof AuthFailureError) {
                    if (getInvalidTokenCount() <= MAX_INVALID_TOKEN_COUNT) {
                        // app should get a fresh token and retry the network request
                        String token = getToken();
                        ChartDataRequest.setToken(token);
                        getChartData();
                    } else {
                        Alerts.showAlert(MainActivity.this, getString(R.string.chart_data_error), getString(R.string.authentication_error));
                    }
                } else {
                    if (volleyError != null) {
                        message = volleyError.getMessage();
                    }
                    if (message == null || message.length() == 0) {
                        message = getString(R.string.network_error);
                    }
                    Alerts.showAlert(MainActivity.this, getString(R.string.chart_data_error), getString(R.string.network_error));
                    chartHandler.onNetworkError(VOLLEY_ERROR, message);
                }
            }
        }) {
            @Override
            public Map<String, String> getHeaders() throws AuthFailureError {
                return ChartDataRequest.getApiHeaders();
            }
        };

    }

    private String getToken() {
        // app developers replace this with code that gets a dynamically-generated token
        return demoToken;
    }

    private int getInvalidTokenCount() {
        invalidTokenCount++;
        return invalidTokenCount;
    }

    private void resetInvalidTokenCount() {
        invalidTokenCount = 0;
    }
Similar code is used to get the issueId for a stock symbol, which is needed for input to the methods above. For an example of this, see getExactRequest() in the sample app's MainActivity.java.
Drawing the Chart
Once the data has come back from the API the data result needs to be passed back to the charting framework. This can be accomplished easily as follows:
private void drawCharts(String json) {
    json = (result from data call in Getting Chart Data)
    chartHandler.drawCharts(json)
}
The json can either be a String or a JSONObject.
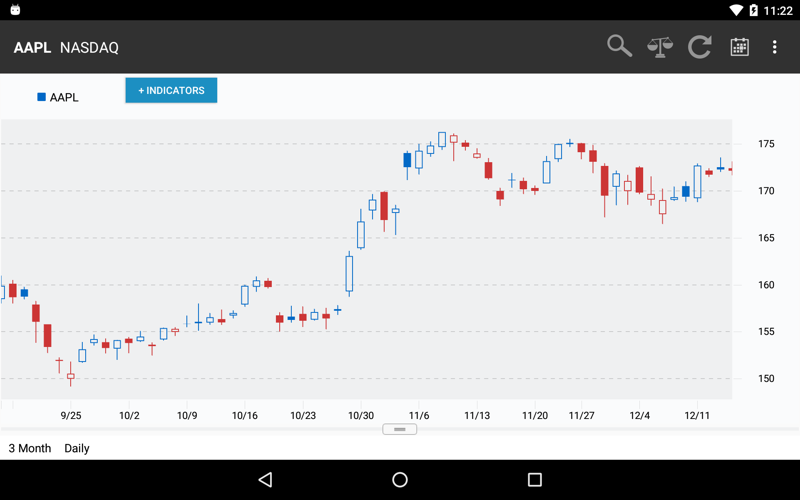
The chart is fully navigable. By pinching and spreading two fingers you can zoom out and zoom in, allowing you to see additional details. You can also use a gesture to pan the chart left and right or up and down. Pressing and holding a tap will show crosshairs and reveal the point value underneath.
Handle Network Error
If a network request fails, you may call onNetworkError(int statusCode, String message) to remove previously-displayed chart data. The app-defined status code and message will not be shown to users.
onNetworkError(100, "Unable to get quote");
Chart Updates
To receive callbacks for chart updates, implement methods defined in the ChartUpdates interface in the activity that will be listening for them.
public interface ChartUpdates {
    /**
     * Called when the app needs to make a chart data request so the chart can be redrawn with new data
     * @param chartDataRequest
     */
    public void updateChartDataRequest(ChartDataRequest chartDataRequest);

    /**
     * Sends back the wsodIssue of the comparer that was removed and the current count of comparers
     * @param wsodIssue
     * @param numberOfComparers
     */
    public void removedComparer(String wsodIssue, int numberOfComparers);

    /**
     * Sends a boolean back if the chart was able to draw with the JSON provided
     * @param success
     */
    public void chartDrawn(boolean success);

    /**
     * Sends a callback once configuration(s) have finished loading
     */
    public void configurationLoaded();

    /**
     * Sends a callback once the object has finished drawing
     * @param drawID
     */
    public void finishedDrawing(String drawID);

    /**
     * Sends a callback once the Upper chart screenshot is finished
     * @param file
     */
    public void upperChartScreenShot(File file);

    /**
     * Sends a callback once the Lower chart screenshot is finished
     * @param file
     */
    public void lowerChartScreenShot(File file);

    /**
     * Sends a call back for data used for the Returns lines
     * @param returnsData
     */
    public void returnsData(ReturnsData returnsData);

    /**
     * Sends a callback asking app to open a text annotation dialog
     */
    public void textAnnotationCreated();
}
Show API Path
String host = ChartDataRequest.getApiHost(getApplicationContext());
String path = ChartDataRequest.getApiPath(getApplicationContext());
Override price symbol
To override the price display pass the override symbol below:
chartDataRequest.setDisplaySymbol(symbol);
Also you need to enable it in the xml config; for example, see chartworks_dark_theme.xml
<boolean name="showDisplaySymbolInLegendInsteadOfNameShortPrice">true</boolean>
Disable Lower Chart
This can be enabled by setting the config in the xml as follows.
<bool name="hideLowerChartAutomatically">true</bool>
This can also be set on the builder
.hideLowerChartAutomatically(false)
Adding and Removing Comparisons
Adding a single comparison on initialization
With the builder you can do the following two ways
        chartHandler = new ChartHandler.Builder(R.id.chart)
                .showDarkTheme(true)
                .setChartStyle(ChartStyle.Mountain)
                .addComparer("MSFT","205778")
//               ... Truncated for brevity.
There is a new object used to handle comparison addition that makes things a little easier.
Comparison(String displaySymbol, String issueId);
Comparison(String displaySymbol, String issueId, @ColorInt int color);
Comparison googlCompare = new Comparison("GOOGL","140864");
or
Comparison googlCompare = new Comparison("GOOGL","140864",Color.RED);
The comparison object has setters and getters for overriding at any time.
        chartHandler = new ChartHandler.Builder(R.id.chart)
                .showDarkTheme(true)
                .setChartStyle(ChartStyle.Mountain)
                .addComparer(googlCompare)
//               ... Truncated for brevity.
If the chart has already been initialized you can use the associated chartHandler method to add the comparison.
chartHandler.addComparer(googleCompare);
Adding multiple comparison on initialization
To add multiple comparisons you can do so as follows
Comparison googlCompare = new Comparison("GOOGL","140864");
Comparison vCompare = new Comparison("V","10808544");
Comparison fCompare = new Comparison("F","104092");
ArrayList<Comparison> comparisons = new ArrayList<>();
comparisons.add(googlCompare);
comparisons.add(vCompare);
comparisons.add(fCompare);
    chartHandler = new ChartHandler.Builder(R.id.chart)
        .showDarkTheme(true)
        .setChartStyle(ChartStyle.Mountain)
        .addComparisons(comparisons)
//      ... Truncated for brevity.
If you have already initalized the charting framework than you can use the chartHandler to accomplish the same goal
chartHandler.addComparisons(comparisons);
Removing comparisons
Removing comparisons will work just as they have before but with two new methods.
if you are referencing your comparisons as objects you just pass that comparison object via the chartHandler method, you can still use the way of just passing an issueID for this as well.
public void removeComparison(Comparison comparison);

chartHandler.removeComparison(comparison);
If you need to remove all comparisons you can do so with the following call
public void removeAllComparisons();

chartHandler.removeAllComparisons();
Time Zones
In version 2.8.0 and later, times shown on the X axis for intra-day charts default to local time in the market where the primary symbol is traded. This can be modified if desired. The following configuration option specifies usage of a fixed time zone (defaulting to U.S. Eastern time, i.e. America/New_York):
<bool name="allowTimeZoneOffset">false</bool>
If allowTimeZoneOffset=false, the fixed time zone can be configured with a value from the tz database, for example:
<string name="timeZone">Europe/London</string>
When stocks are compared, the time zone of the primary symbol is used. If the comparison symbol trades in a different time zone, by default its chart is offset appropriately reflecting the start and end of its trading day. However, if desired, it can be shown as if it traded in the same time zone by setting the following option:
<bool name="shouldNormalizeComparisonTimeZone">true</bool>
Customizing the legend
Changing Indicator alignment
- To update the indicator alignment just add or override this xml configuration in your xml config.
<string name="alignLegendIndicators">center</string> - The possible strings are as follows
- start
- left
- center
- right
- end
Customize the upper and lower legend height
- This can now be controlled in the dimensions xml, just add the following dimension to override the default for the charting library. Very useful for phones that have limited space.
<dimen name="cw_indicator_min_height">28dp</dimen>
Customize the upper legend width
- You can update the width of the column for each indicator in the upper legend based on this dimension.
<dimen name="cw_upper_legend_column_width">120dp</dimen>Customize the lower legend width
- You can update the width of the column for each indicator in the lower legend based on this dimension.
<dimen name="cw_lower_legend_column_width">120dp</dimen>
Customize the indicator text size
- You can now update the indicator text size and override it for specific dimensions.
<dimen name="cw_indicator_text_size">14sp</dimen>
Customize to remove interactivity of a legend
- You can disable clicks in the upper or lower button bar to prevent users removing indicators or
comparison symbols.
  <bool name="indicatorUpperButtonBarInteractionEnabled">false</bool>
  <bool name="indicatorLowerButtonBarInteractionEnabled">false</bool>
Handling Errors
@Override
public void noDataToShowForUpperChart() {

}
This error callback occurs when the upper chart can not draw a price chart, this generally occurs when there is not enough data to plot or no data was recieved to plot a chart.
@Override
public void noDataToShowForLowerChart(LowerIndicator lowerIndicator) {

}
This error callback is occurs when the lower chart can not draw the associated lowerIndicator.
The ChartViewIndicatorListener has an onApiError result that let's you know that there was a problem with the request.
 @Override
public void onApiError(Error error) {
  // .. Handle errors
}
Error Codes:
- Error 400: Bad Request: Missing IssueId in request. Ensure charthandler.setMainIssueId(...) is being called before getChartDataRequest().
- Error 401: Missing Elements: the list of indicator elements was empty
- Error 402: Missing Timeframe: the time frame's frequency period (e.g. "Minute") was not supplied
- Error 403: Exception: An exception was caught while processing the chart data request
Detailed Setup
In order to create a chart with data, you need to set up the chart layout and the define information about the chart.
Configuration
The configuration options are defined in raw XML resource files which can override default settings in the SDK. The sample app uses two such configuration files, one each for light and dark theme:
chartworks_dark_theme.xml
chartworks_light_theme.xml
The config file can be specified as follows, for example using a dark theme:
chartBuilder.setConfigIds(R.raw.chartworks_dark_theme);
chartBuilder.showDarkTheme(true);
In the following sections, options which can be specified in the config file are described.
Set Initial Chart Layout
To set the initial chart object, you need to set the position, height of the upper chart, and add your chart to the view. A lower chart can also be added (but it is not required) and a gutter height between the two charts. Add a layout you wish to replace with the fragment.
For example,
<FrameLayout
  android:id="@+id/chart"
  android:layout_width="match_parent"
  android:layout_height="wrap_content" />
The chart ID is used in the builder to define the view that will be replaced with the charting fragment.
Android Only Properties
For the most part, the properties in the iOS SDK work in the Android SDK. These properties are special to the Android SDK.
upperChartPercentSize
Sets the default size percent for Upper chart.
lowerChartPercentSize
Sets the default size percent for Lower chart.
dividendBorderSize
Sets the border size for Dividends.
dividendStickWidth
Sets the stick width for Dividends.
dividendStickHeight
Sets the stick height for Dividends.
dividendTextSize
Sets the text size for Dividends.
earningsBorderSize
Sets the border size for Earnings.
earningsStickWidth
Sets the stick width for Earnings.
earningsStickHeight
Sets the stick height for Earnings.
earningsTextSize
Sets the text size for Splits.
styleOHLCTrunkWidth
Sets the OHLC trunk width.
styleOHLCArmWidth
Sets the OHLC arm width.
styleCandlestickStickWidth
Sets the CandleStick's stick width.
splitsBorderSize
Sets the border size for Splits.
splitsStickWidth
Sets the stick width for Splits.
splitsStickHeight
Sets the stick height for Splits.
splitsTextSize
Sets the text size for Splits.
splitsShowArrow
Displays an arrow instead of a stick for Splits.
crossHairLineWidth
Sets the crosshair line width.
indicatorPopupFontSize
Sets the font size for Indicator Popup.
indicatorPopupTitleFontSize
Sets the title font size for Indicator Popup.
upperTickLineWidth
Sets the upper tick line width.
upperTickGap
Sets the upper tick gap size.
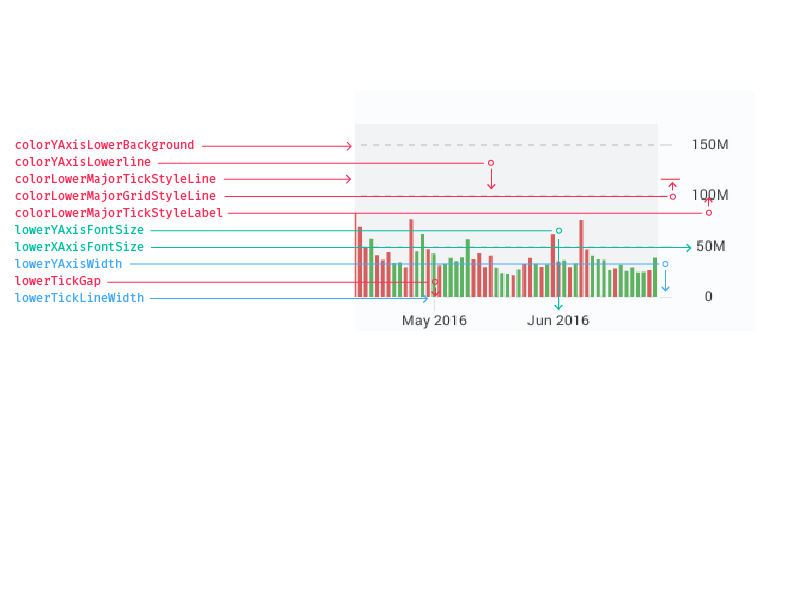
lowerTickLineWidth
Sets the lower tick line width.
lowerTickGap
Sets the lower tick gap size.
upperYAxisWidth
Sets the upper Y axis width.
lowerYAxisWidth
Sets the lower Y axis width.
upperXAxisFontSize
Sets the upper X axis font size.
upperYAxisFontSize
Sets the upper Y axis font size.
lowerXAxisFontSize
Sets the lower X axis font size.
lowerYAxisFontSize
Sets the lower Y axis font size.
YAxisPaddngPercent
Sets the upper and lower Y axis padding percent.
open
Sets the open text.
high
Sets the high text.
low
Sets the low text.
close
Sets the close text.
Colors
In standard Android we parse colors as ARGB whereas iOS and the web uses RGBA. To make configurations universal, the correct input into the configuration is RGBA for both Android and iOS.
Ex. #RRGGBBAA
Menus
The SDK will call back to the app when a user action occurs for which a menu should be displayed, using methods defined in the ChartViewIndicatorListener interface:
public interface ChartViewIndicatorListener   {
    void addIndicatorUpperButtonTapped(View view);
    void addIndicatorLowerButtonTapped(View view);
    void removedLowerIndicator(Indicator<LowerIndicator> indicator, ArrayList<Indicator<LowerIndicator>> currentLowerIndicatorList, ArrayList<Indicator<LowerIndicator>> lowerIndicatorList);
    void removedUpperIndicator(Indicator<UpperIndicator> indicator, ArrayList<Indicator<UpperIndicator>> currentUpperIndicatorList, ArrayList<Indicator<UpperIndicator>> upperIndicatorList);
    void noDataToShowForUpperChart();
    void noDataToShowForLowerChart(LowerIndicator lowerIndicator);
    void onApiError(Error error);
}
It's up to the app to display menus and respond to user selections. For example code, see the sample app's definition of addIndicatorUpperButtonTapped() in MainActivity.java.
Error Logging
To enable error logging, call the setLogLevel method in the ChartBuilder class:
    // optional log level for SDK logging: Info, Warn, Error, or (default) None
    chartBuilder.setLogLevel(ChartHandler.LogLevel.Info);
The Info level will log top-level methods in the SDK. Log messages can be viewed in Android Device Monitor or Android Studio's Logcat pane. To see only these messages, filter by log tag "MarkitCharts".
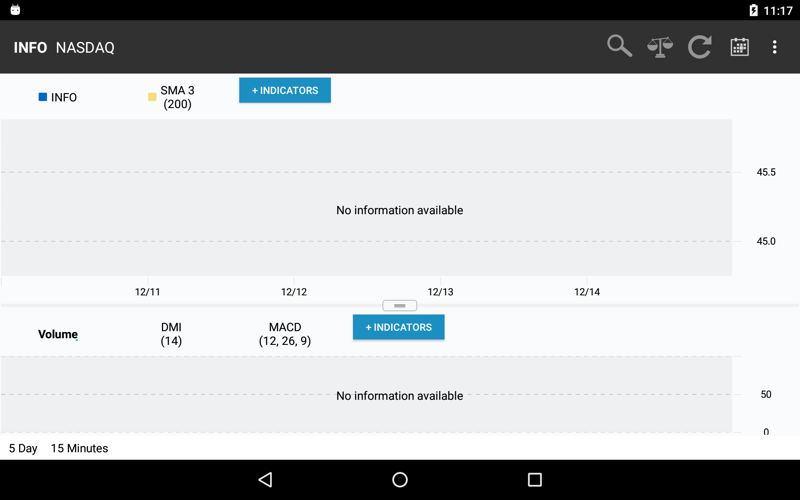
The message which appears in the charts when data is unavailable can be customized in the configuration files:
    <string name="stringUpperChartNoDataMessage"><![CDATA[No information available]]></string>
    <string name="stringLowerChartNoDataMessage"><![CDATA[No information available]]></string>
Features
Gesture Loading
Pan
Users can pan on the app to see more data. Scroll in the direction of the orientation of the chart to pan.
Pinch and Zoom
In addition to panning, users can pinch and zoom by moving two fingers together and apart on the on the chart. This gesture causes the chart to zoom in or out.
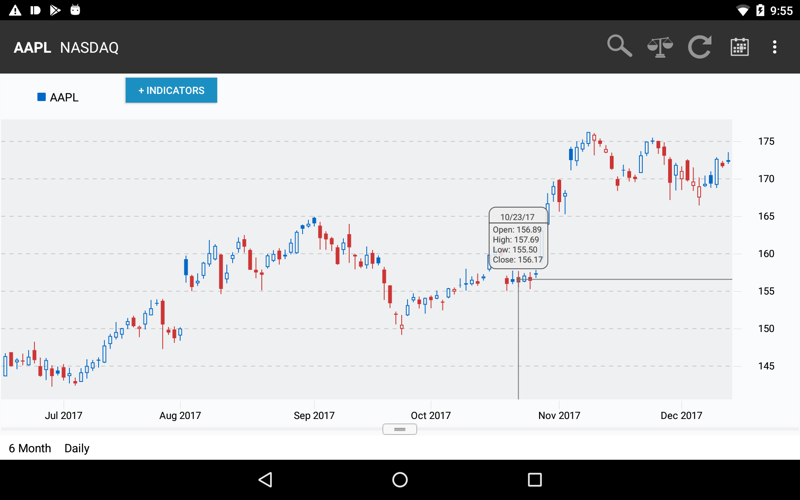
One Finger Holding
Holding one finger on the data in the chart causes the crosshair to appear which displays the date and time of the data, the open and close price and the high and low price. By tapping on the chart again, it will remove the crosshair.
Crosshairs Options
Crosshairs appear when you long-press a single finger on the upper chart. The following configuration options are available:
colorCrosshair
colorCrosshairViewBackground
colorCrosshairViewBorder
colorCrosshairViewText
crossHairLineWidth
crossHairPositionFixed
The crossHairPositionFixed option specifies how upper chart crosshair data is shown. When false (the default), data is shown in a floating rounded rectangle (see image above). When set true, the data is shown in a fixed position centered at the top of the upper chart.
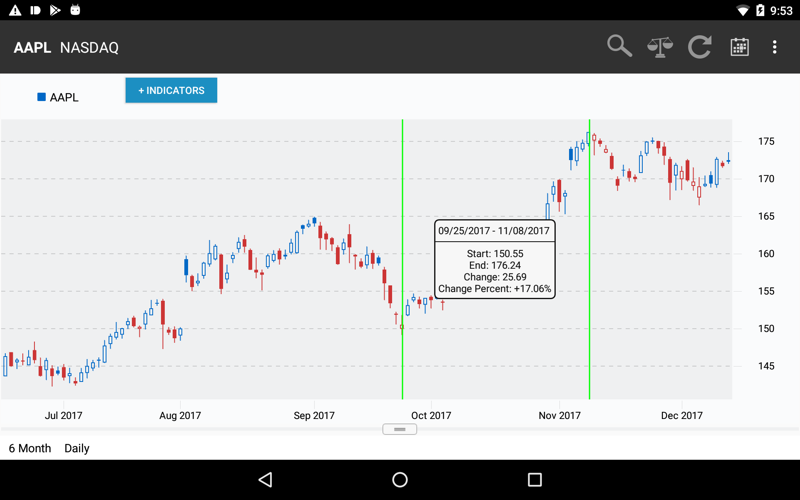
Two Finger Holding
Holding two fingers on the chart causes the period change to appear. This displays the date and time for the first and second point. It also shows the prices of each point. It also shows percent increase or decrease within the period change. By tapping on the chart again, it will remove the period change.
Styles
The look and feel of the chart view is controlled by the developers. The Android SDK does not dictate the colors, fonts, custom buttons, and sizes of the upper & lower charts. See below for details on what can be customizable.
Upper Chart Axes
The diagram below displays all of the different properties that can be customized on the upper chart axes.
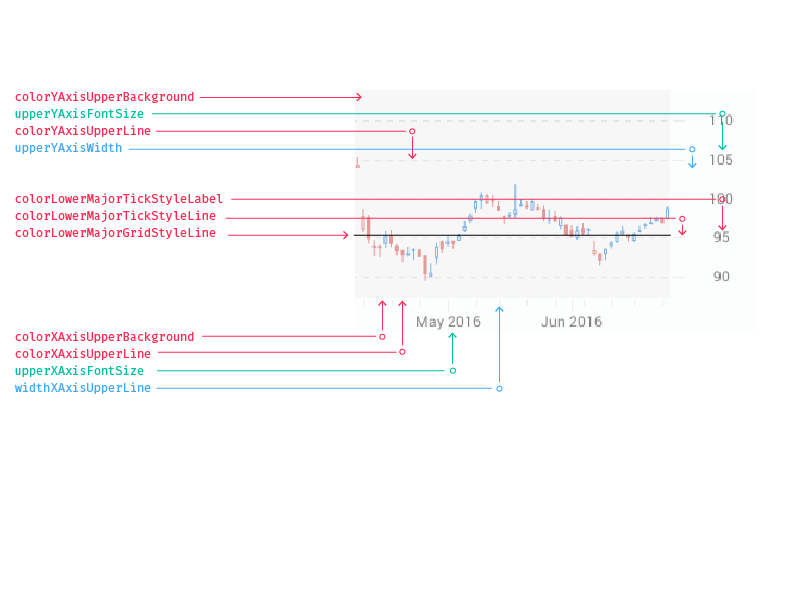
Lower Chart Axis
The diagram below displays all of the different properties that can be customized on the lower chart axis.
Custom Timestamps
There are timestamps that can be customizable. The amount of data on the chart dictates which format is displayed. You have the freedom to edit these though.
yearFormat
Displays the year only. The default format is "Y".
Ex. 2016
monthYearFormat
Displays the month and the year together. The default format is "MMM Y".
Ex. Jun 2016
monthDayFormat
Displays the month and the day together. The default format is "M/D".
Ex. 6/23
hourMinuteFormat
Displays the hour and the minute together. The default format is "H:MM A".
Ex. 3:00 PM
monthDayYearFormat
Displays the date with the month, day, and year. It is used in the crosshair. The default format is "MM/DD/YY".
Ex. 06/23/16
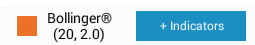
Indicator Legend Buttons
The legend buttons that appear for upper and lower indicators can be configured with an image or a background color. If an image is provided it must be 75 x 20 px in size and a highlighted version of that image should be supplied or the non-highlighted image will be used for the highlighted state. If a background image is specified the background color is ignored.
imageforUpperIndicatorButton
The image for the upper indicator button. There is a setting for the lower indicators as well. It is the Bollinger image in the example.
imageforUpperIndicatorButtonHighlighted
The image for the upper indicator button highlighted. There is a setting for the lower indicators as well. This is set to white (#1C8FC2FF) in the example.
fontUpperIndicatorButton
The font for the upper indicator button. This can also be set for lower indicators.
colorUpperIndicatorButtonBackground
The color of the upper indicator button background. This is set to blue (#0067C6FF) in the example.
colorUpperIndicatorButtonHighlightedBackground
The color for the upper indicator button highlighted background. This is not displayed in the example.
Indicator Information and Parameter Settings
The diagram below shows all the different properties that can be customizable for the indicator popovers.
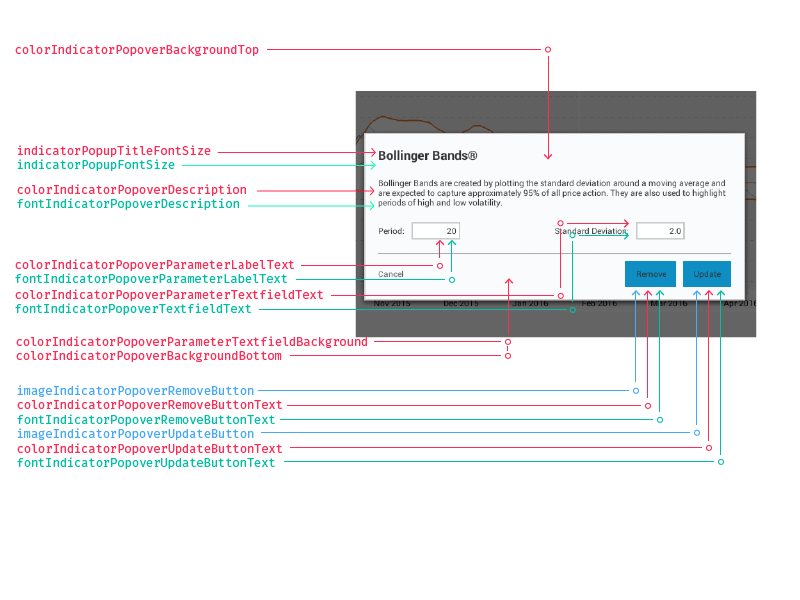
For more details, please see the Javadocs.
Types of Charting
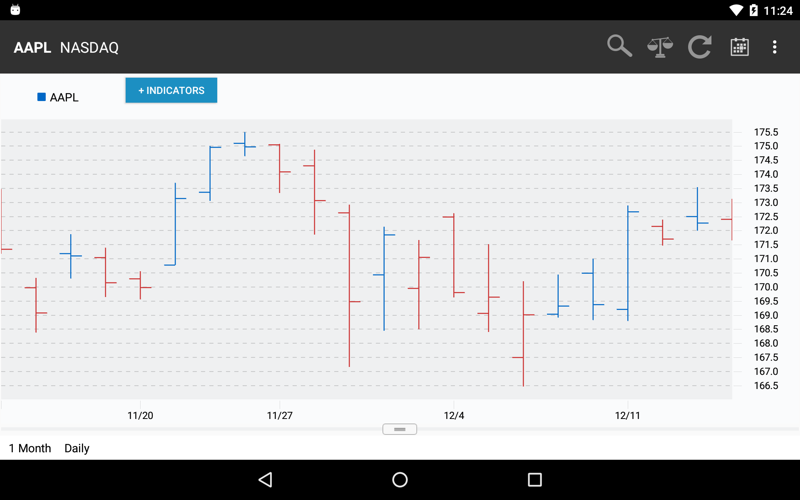
Candlestick
There are some different parameters that you can set for the candlestick style:
colorStyleCandlestickRising
The color of the rising candlesticks. It is set to blue (#0067C6FF) in the example below.
colorStyleCandlestickFalling
The color of the falling candlesticks. The example is set to red (#CC3333FF).
styleCandlestickStickWidth
The width of the candlestick stick. The example is set to 1.5.
OHLC
colorStyleOHLCRising
The OHLC color for a rising segment. It is set to blue (#0067C6FF) in the example below.
colorStyleOHLCFalling
The OHLC color for a falling segment. The example is set to red (#CC3333FF).
styleOHLCArmWidth
The width of the OHLC arm. The example is set to 3.
styleOHLCTrunkWidth
The width of the OHLC trunk. The example is set to 3.
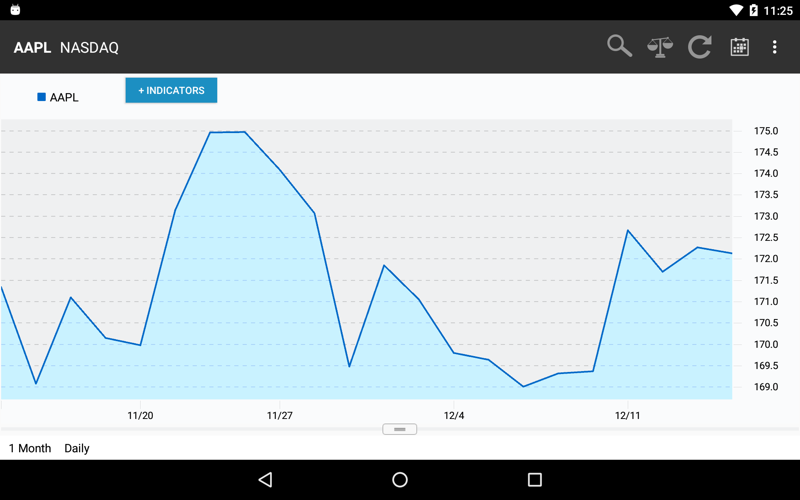
Mountain
colorStyleMountainLine
The color of the top edge of a mountain chart. It is set to blue (#0067C6FF) in the example below.
colorStyleMountainAreaFill
The fill color of mountain charts. This is set to a lighter shade of blue (#0067C666) in the example below.
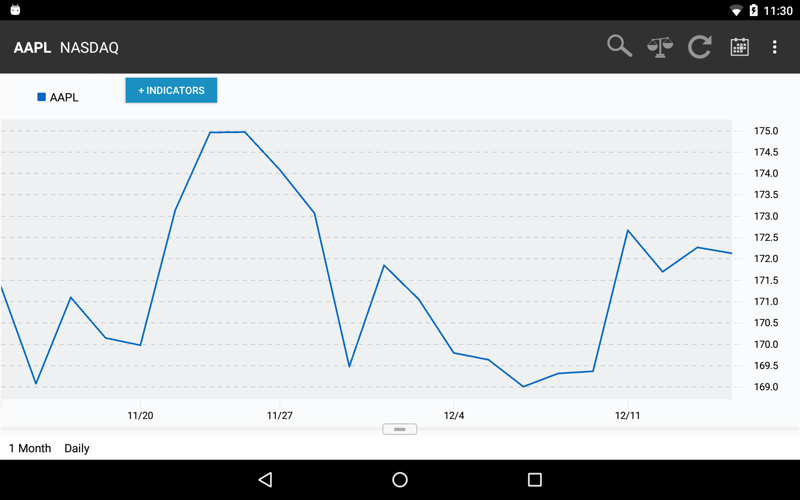
Line
colorStyleLine
The color for line charts. It is set to blue (#0067C6FF) in the example below.
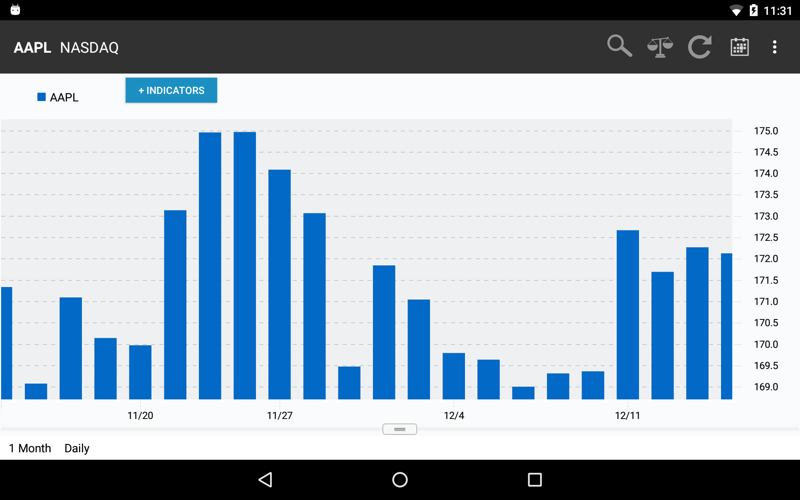
Bar Graph
colorStyleBar
The color bar price charts. The example is set to blue (#0067C6FF).
Indicators
Upper Indicators Inputs
Bollinger Bands
- Period (int)
- Standard Deviation (int)
Dividends
- None
Exponential Moving Average (EMA)
- Period (int)
Linear Regression
- None
Moving Average Envelope (MAE)
- Period (int)
- Percent (int)
Price High & Low
- None
Price Channel
- Period (int)
Parabolic Stop and Reversal (PSAR)
- Initial Position (int)
- Acceleration Increase (double)
- Acceleration Maximum (double)
Simple Moving Average (SMA)
- Period (int)
Splits
- None
Time Series Forecast (TSF)
- Period (int)
Weighted Moving Average (WMA)
- Period (int)
Lower Indicators Inputs
Accumulation Distribution
- None
Average True Range (ATR)
- Period (int)
Chaikin's Volatility
- EMA Period (int)
- Difference Period (int)
Dividend Yield
- None
Directional Movement Index (DMI)
- Period (int)
Historical Dividend
- None
Moving Average Convergence-Divergence (MACD)
- Fast points (int)
- Slow points (int)
- Smoothing (int)
Mass Index
- Period (int)
- Setup Line (int)
- Trigger Line (double)
Momentum
- Period (int)
Money Flow
- None
Money Flow Index
- Period (int)
On Balance Volume
- None
Price Rate of Change (PROC)
- Period (int)
Relative Strength Index (RSI)
- Period
Rolling Dividend Yield
- None
Fast Stochastics
- Period 1 (int)
- Period 2 (int)
- Smoothing (int)
Slow Stochastics
- Period 1 (int)
- Period 2 (int)
- Smoothing (int)
Ultimate Oscillator (ULT OSC)
- Period 1 (int)
- Period 2 (int)
- Period 3 (int)
- Factor 1 (int)
- Factor 2 (int)
- Factor 3 (int)
Volume
- None
Volume Rate of Change
- Period (int)
Williams %R
- Period (int)
Zoom In/Out
The user can zoom in/out by using their fingers to pinch or expand the chart. When zooming out, pinch and hold, then release to trigger a request for additional chart data.
Tools/Annotation
Several drawing tools are available to users when the chart is placed in the appropriate mode. To do this, call chartHandler.drawOnChart() with the desired option. For example:
chartHandler.drawOnChart(DrawingMode.TREND_LINE);
Other supported drawing modes include LEVEL_LINE, TEXT, RAY, EXTENDED_LINE, FIBONACCI_RETRACEMENT, FIBONACCI_ARC, and FIBONACCI_CIRCLE. When the user has finished drawing there will be a callback to the finishedDrawing method, which the should defined as follows:
    @Override
    public void finishedDrawing(String drawID) {
        chartHandler.drawOnChart(DrawingMode.NO_DRAWING);
    }
To remove the last drawn object, get the drawIDs and call removeDrawnObject as follows:
    drawIDs = chartHandler.getDrawnIDs();
    if (drawIDs.size() > 0) {
        chartHandler.removeDrawnObject(drawIDs.get(drawIDs.size() - 1));
    }
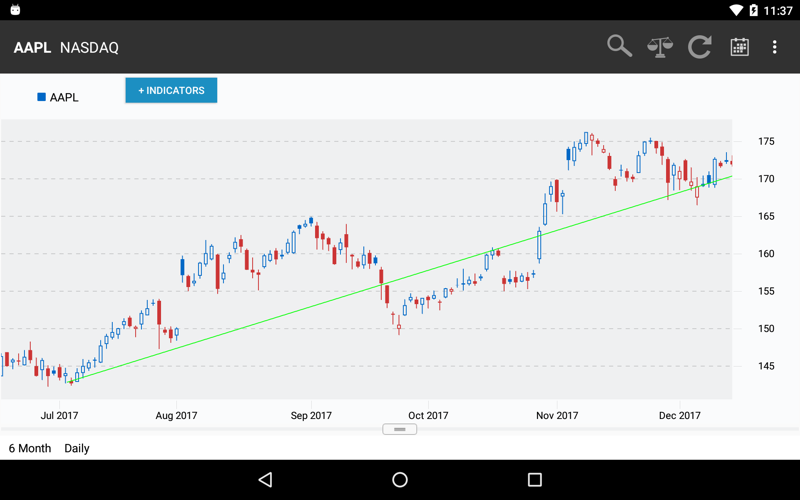
Trend Line
Here is an example of a chart with a trend line drawn:
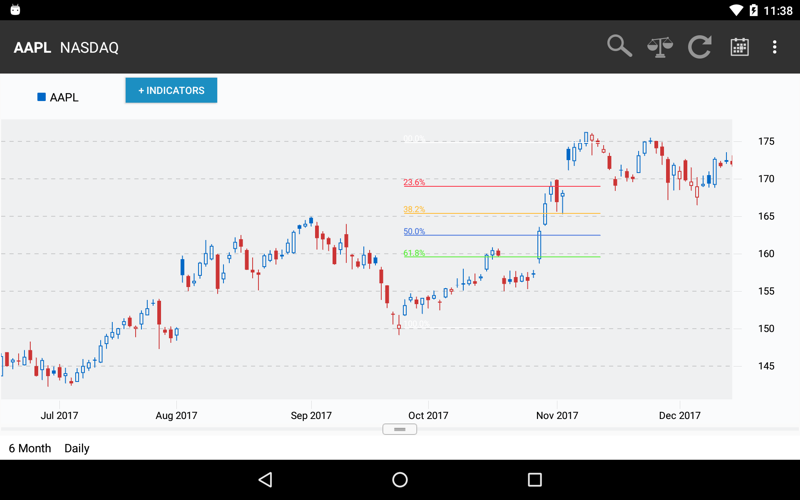
Fibonacci Retracement
Here is an example of a chart with Fibonacci Retracement lines drawn:
Frequently Asked Questions
Q: Where is the separation between what the SDK framework provides and what a client's development team must provide?
A: The SDK will provide the complete workflow for everything that is inside the chart. The buttons around the chart that change the scale or allow the entry of a symbol is treated separately from the SDK and thus can be customized by the clients for their own needs.
Q: Is there any third party technology that the SDK depends on?
A: Yes. The SDK currently leverages both open source and proprietary technologies.
Q: Is the source code available for the Chartworks framework?
A: Markit will provide the framework headers, library, sample library and documentation that can be used to add interactive charting to a client application. At this time, source code for the actual framework is not provided.
Q: Who handles the support should an issue arise while using the Chartworks framework or any of its underlying technologies?
A: Markit will provide support. It is not necessary to work directly with any third party vendor.
For more details on the Android SDK, please visit the Javadocs.
Change Log
Version 2.8.2 is the current stable release.
2.8.2
New Features in version 2.8.2
- Added configuration options for gridlines (see Programming Notes)
- Improved performance of floating X-Axis legend during pan and zoom
- Symbol search in sample app now uses Predictive API to show matches of company name or symbol
Bug Fixes
- Fixed loading spinner so it continues after rotation if data load is still in progress
- Changed the default color of Fibonacci Retracement 0% and 100% lines from white to gray
- Fixed number formatting of crosshairs data when viewing the On Balance Volume indicator
- Fixed a race condition that could cause incorrect chart size after rotation
- Corrected the time frame for YTD charts in the sample app
- Improved number formatting for the Latest Price indicator
- Fixed issues that occurred when panning after a Ray or Extended Line drawing was added
- Removed the chart resizing gripper when there's no lower indicator in single lower chart mode
- Retained user-modified chart size percentage on rotation
Programming Notes
New options for configuration of gridlines
Chart gridlines may be enabled, disabled or modified via XML configuration files. The following options are now available (defaults in parentheses):
- majorGridLinesDashedUpper (true) -- set false for solid gridlines in upper charts
- majorGridLinesDashedLower (true) -- set false for solid gridlines in lower charts
- showXAxisMajorGridLinesUpper (false) -- vertical gridlines for upper charts
- showXAxisMajorGridLinesLower (false) -- vertical gridlines for lower charts
- showYAxisMajorGridLinesUpper (true) -- horizontal gridlines for upper charts
- showYAxisMajorGridLinesLower (true) -- horizontal gridlines for lower charts
- widthMajorGridLinesDashedUpper (3.0) -- dash/space pattern width (dp) for upper charts
- widthMajorGridLinesDashedLower (3.0) -- dash/space pattern width (dp) for lower charts
- thicknessMajorGridLinesUpper (1.0) -- line thickness (dp) for upper charts
- thicknessMajorGridLinesLower (1.0) -- line thickness (dp) for lower charts
- colorUpperMajorGridStyleLine (#C8C9CAAA or #7C878EAA) -- upper chart gridline color (#RRGGBBAA) for light or dark theme
- colorLowerMajorGridStyleLine (#C8C9CAAA or #7C878EAA) -- lower chart gridline color (#RRGGBBAA) for light or dark theme
Default values for all configuration options are shown in files in the Documentation folder of the release package.
v2.8.1
New Features in version 2.8.1
- Added a setter for ChartUpdates
- Added an option to set parameters when adding indicators programmatically
- Added methods to allow the app to control when the progress indicator is shown
- Provided the capability to customize the progress indicator's appearance
- Added capability to hide the button for Lower Indicator 'Volume'
- Added configuration options for adjusting spacing of X and Y axis tick marks and labels
- Documented configuration options for indicator popover dialogs
- Added XML files and a spreadsheet documenting configuration options
Refer to Programming Notes below for details of the items above.
Bug Fixes in version 2.8.1
The following issues were fixed:
- Bollinger bands Standard Deviation text entry field is not visible on some devices
- Zoom-in is inhibited when an extended line or ray extending into the past is shown
- Selecting MAX timeframe causes app to hang when symbol has fewer than 40 years of volume data
- Calls to drawCharts will now result in callback to onApiError if required preconditions are not met
- Allow app to set the legend font size and spacing (see Programming Notes)
- Horizontal gridline and Y-axis legend intervals change more gradually as chart is panned or zoomed
- Partial underlining of indicator labels in lower chart legend has been removed
- The Remove button is now hidden in the popover dialog for the primary price symbol
- Fixed an issue in which dividends were not removed when the symbol changed
- Added checks for null before calling ChartUpdates methods
Programming Notes
Setter for ChartUpdates
If ChartUpdates methods are implemented in a fragment enclosing the chart fragment, rather than in the host activity, call setChartUpdates as soon as the ChartHandler interface has been obtained from the fragment manager. For example:
chartHandler = (ChartHandler) getChildFragmentManager().findFragmentById(R.id.chart);
chartHandler.setChartUpdates(this);
Adding indicators programmatically
When adding indicators programmatically, an optional HashMap containing parameters may be passed:
/**
 * Add or remove an indicator
 * @param indicatorId - string name of indicator
 * @param isActive - true to add, false to remove
 * @param params - optional HashMap<String, Number> string parameter name, integer or double value
 */
public void setIndicatorIsActive(String indicatorId, boolean isActive, HashMap... params);
For example:
HashMap<String, Number> params = new HashMap<>();
params.put(Indicator.PARAM_PERIOD, 25);
params.put(Indicator.PARAM_STANDARD_DEVIATIONS, 2.5);
chartHandler.setIndicatorIsActive(Indicator.BOLLINGER_BANDS, true, params);
Controlling when the progress indicator is shown
New methods were added to enable the app to control when the progress indicator is shown:
void showProgressIndicator();
void hideProgressIndicator();
When using these methods disable automatic progress in the XML configuration file:
<bool name="showLoadingProgress">false</bool>
Customizing the progress indicator's appearance
To control the appearance of the progress indicator, app developers may either call a new method to set the indeterminate mode drawable, or define a style that sets the drawable and other style elements. The new method should be called from onResume() to ensure the SDK has completed its initialization of the ProgressBar:
/**
 * Set the drawable for progress (indeterminate mode)
 */
void setProgressDrawable(Drawable drawable);
If instead you define a style named AppProgressBarStyle, it isn't necessary to call the above method. For example, add this to styles.xml:
<style name="AppProgressBarStyle" parent="@android:style/Widget.ProgressBar.Inverse">
 <item name="android:indeterminateDrawable">@drawable/progress_bar</item>
 <item name="android:indeterminate">true</item>
</style>
The progress_bar drawable referred to above may be defined in an XML file so it rotates, as in the example below, which refers to an image file named refresh.png:
<layer-list xmlns:android="http://schemas.android.com/apk/res/android">
<item>
 <rotate
 android:drawable="@drawable/refresh"
 android:pivotX="50%"
 android:pivotY="50%"
 android:fromDegrees="0"
 android:toDegrees="360"
 />
</item>
</layer-list>
The sample app currently uses the style shown above to define a custom drawable; the call to setProgressDrawable() is commented out.
Setting legend font size and spacing
The legends are GridView elements defined in SDK layout files. The spacing is set by a dimension defined in dimens.xml:
<dimen name="cw_upper_legend_column_width">120dp</dimen>
<dimen name="cw_lower_legend_column_width">120dp</dimen>
The string "+ INDICATORS" which appears in a button may be redefined in config files:
<string name="stringUpperLabelButtonIndicators">+ Indicators</string>
<string name="stringLowerLabelButtonIndicators">+ Indicators</string>
Their font size is 14sp, defined in dimens.xml:
<dimen name="cw_add_indicator_text_size">14sp</dimen>
The + Indicators button height is defined in dimens.xml:
<dimen name="cw_add_indicator_button_height">30dp</dimen>
The + Indicators button width is set to wrap_content. Padding to left and right of the text is defined in dimens.xml:
<dimen name="cw_add_indicator_button_padding">5dp</dimen>
The button margin is defined in dimens.xml:
<dimen name="cw_add_indicator_button_margin">12dp</dimen>
The indicator labels' font size is set by:
<dimen name="cw_indicator_text_size">14sp</dimen>
Min height is:
<dimen name="cw_indicator_min_height">38dp</dimen>
The alignment of each indicator legend within its grid area defaults to center, but may be redefined to left or right in the config file:
<string name="alignLegendIndicators">center</string>
Hiding the Volume indicator button
When the multiple lower charts option is enabled, the button for Volume may be programmatically hidden using the following ChartHandler method:
    /**
     * setVolumeButtonShown
     * @param isShown - if false, when a Volume chart is one of multiple lower charts,
     *                it will not have a button (default is true)
     */
    public void setVolumeButtonShown(boolean isShown);
Adjusting spacing of X and Y axis tick marks and labels
The following XML configuration options control tick mark length for X and Y axes of the lower and upper charts (default 10.0, in dp):
lowerXAxisTickLength
lowerYAxisTickLength
upperXAxisTickLength
upperYAxisTickLength
The following XML configuration options control tick mark gap (space between tick mark and label) for X and Y axes of the lower and upper charts (default 0.0, in dp):
lowerXAxisTickGap
lowerYAxisTickGap
upperXAxisTickGap
upperYAxisTickGap
The following XML configuration options control tick mark label font size for X and Y axes of the lower and upper charts (default 12.0, in sp):
lowerXAxisFontSize
lowerYAxisFontSize
upperXAxisFontSize
upperYAxisFontSize
The following XML configuration options control axis width (margin from axis to edge of chart) for Y axes of the lower and upper charts (default 12.0, in dp):
lowerYAxisWidth
upperYAxisWidth
As an example of the above options, and to reduce space used in tick mark labels and margins, the sample app now uses the following settings:
<float name="lowerXAxisFontSize">10.0</float>
<float name="lowerXAxisTickGap">2.5</float>
<float name="lowerXAxisTickLength">5.0</float>

<float name="lowerYAxisFontSize">10.0</float>
<float name="lowerYAxisTickGap">-15.0</float>
<float name="lowerYAxisTickLength">5.0</float>
<float name="lowerYAxisWidth">40.0</float>

<float name="upperXAxisFontSize">10.0</float>
<float name="upperXAxisTickGap">2.5</float>
<float name="upperXAxisTickLength">5.0</float>

<float name="upperYAxisFontSize">10.0</float>
<float name="upperYAxisTickGap">-15.0</float>
<float name="upperYAxisTickLength">5.0</float>
<float name="upperYAxisWidth">40.0</float>
Configuration options for indicator popover dialogs
The following options are available for customization of dialogs that appear when an indicator legend label is tapped:
colorIndicatorPopoverBackgroundTop
colorIndicatorPopoverBackgroundBottom
colorIndicatorPopoverBackgroundBorder
colorIndicatorPopoverName
colorIndicatorPopoverDescription
colorIndicatorPopoverUnderline
colorIndicatorPopoverRemoveButtonColor
colorIndicatorPopoverRemoveButtonText
colorIndicatorPopoverUpdateButtonColor
colorIndicatorPopoverUpdateButtonText
colorIndicatorPopoverCancelButtonColor
colorIndicatorPopoverCancelButtonTextColor
colorIndicatorPopoverParameterLabelText
colorIndicatorPopoverParameterTextfieldText
colorIndicatorPopoverParameterTextfieldBackground
colorIndicatorPopoverParameterTextfieldBorder
indicatorPopupCancelButtonAlignment
indicatorPopupCancelButtonMinWidth
indicatorPopupFontSize
indicatorPopupTitleFontSize
stringLabelButtonRemove
stringLabelButtonUpdate
stringLabelButtonCancel
Two of the above options are new: indicatorPopupCancelButtonAlignment (default "left") may be changed to "center"; this is useful if colorIndicatorPopoverCancelButtonColor is changed from the default transparent value, #00000000. In that case another new option, indicatorPopupCancelButtonMinWidth (default 80, in dp), may also be adjusted. Note that where color values in config files specify alpha they must follow iOS format, #RRGGBBAA, the last two hex digits specifying the alpha value (00 for transparent, FF for opaque).
The colorIndicatorPopoverBackgroundTop and colorIndicatorPopoverBackgroundBottom options may be set to different values to provide a gradient color effect.
XML configuration option defaults
The Documentation folder in the SDK release package now includes files containing configuration options and their default values. For color options there are files for light and dark themes:
color_dark.xml
color_light.xml
Non-color options (true/false and floating point values) are documented in:
config.xml
Configurable names, descriptions and other string values are listed in an Excel-format spreadsheat:
config-strings.xlsx
When specifying string options, enclosing the value in a CDATA (character data) section will prevent characters in the value being interpreted as XML markup. For example:
<string name="nameChaikinsVolatility"><![CDATA[Chaikin's Volatility]]></string>
To minimize the time required to initialize configuration options on startup, include only non-default values in the configuration file, as in the sample app's files for dark and light theme:
chartworks_dark_theme.xml
chartworks_light_theme.xml
v2.8.0.1
Released August 2018
Bug Fixes in version 2.8.0.1
- Fixed an exception that occurred when a comparison symbol was added
v2.8.0
New Features in version 2.8.0
- Improved performance of charts with longer time frames
- Improved initialization performance by loading less XML configuration data
- Enhanced Save Screenshot to support multiple lower charts
- Added support for CDNs in symbol lookup using the exact API
- X-axis labels for intraday charts now default to primary symbol's time zone
- Added support for Accumulation/Distribution Line in lower indicators
- Sample app's initial theme and chart settings are saved on device
Bug Fixes
- Fixed a file permission issue with Save Screenshot
- Fixed an issue affecting the X-axis position of intra-day chart data
- Fixed an issue causing floating X-axis labels to overlap
- Fixed an issue causing incorrect Y-axis range after change of symbol
- Fixed an involving restoration of state when resuming a stopped app
- Fixed an issue involving display of currency data
- Fixed an issue in which drawings extended outside chart bounds
- Fixed an issue in which date dividers scrolled beyond chart bounds
- Fixed an issue affecting appearance of lower indicator buttons in Android 4.x
- Fixed issues affecting operation of dialog boxes after rotation
- Fixed an issue with ordinates of stacked series in column data for lower indicators
Programming Notes
The default behavior of times shown on the X axis has changed to local time in the market where the primary symbol is traded. This can be modified if desired. The following configuration option specifies usage of U.S. Eastern time (America/New_York):
<bool name="allowTimeZoneOffset">false</bool>
v2.7.1
Released April 2018
New Features
- SDK performance improvements when panning
- New SDK method allows app to enable or disable pan and zoom
- Data APIs provide local termination of SSL to improve response time
Bug Fixes
- Fixed a crash that occurred when removing a comparison
- Implemented a callback method to notify app when a comparison is removed
Programming Notes
- To improve API response time by terminating SSL locally, use the following URLs:
symbol_lookup_api:
https://api.wallst.com/apiman-gateway/MOD/chartworks-xref/1.0/xref/exact?inputs=

chart_api:
https://api.wallst.com/apiman-gateway/MOD/chartworks-data/1.0/chartapi/series
These APIs use Ping authentication as described in the 2.6.0 release notes.
- The following method is now called in the client app when a comparison is removed:
public interface ChartUpdates {
    /** removedComparer
     * Send back wsodIssue of comparer removed and current count of comparers
     * @param wsodIssue
     * @param numberOfComparers
     */
    public void removedComparer(String wsodIssue, int numberOfComparers);
}
- New methods were added to control panning and zooming, which is enabled by default.
public interface ChartHandler {
    /** setPanZoomEnabled
     * @param panZoomEnabled - true: enable pan and zoom (enabled by default)
     */
    public void setPanZoomEnabled(boolean panZoomEnabled);

    /** isPanZoomEnabled
     * @return - true if pan and zoom are currently enabled
     */
    public boolean isPanZoomEnabled();
}
v2.7.0
Released February 2018
New Features
- New drawing tools: Arrow, Rectangle, Ellipse
- Added a method to remove all drawn objects
Bug Fixes
- Fixed a bug causing generation of unneeded tick mark label data for dates not shown
- Fixed a bug causing incorrect Y axis range while panning when no lower chart was shown
- Fixed a client-reported bug causing overlapping tick mark labels in charts of overseas indexes
Programming Notes
Configuration options and defaults were added for new drawing tools (width in dp):
    <color name="colorArrowLine">#4983B3</color>
    <float name="widthArrowLine">2.0</float>
    <float name="widthArrow">10.0</float>

    <color name="colorRectangleLine">#97040B</color>
    <float name="widthRectangleLine">2.0</float>

    <color name="colorEllipseLine">#FEA428</color>
    <float name="widthEllipseLine">2.0</float>
A new method was added to allow removal of all user-drawn objects:
public void removeAllDrawnObjects();
v2.6.2
Released January 2018
Bug Fixes
- Fixed a bug causing incorrect Y-axis range when time frame is changed
v2.6.1
Released January 2018
Bug Fixes
- Fixed a bug causing 1-day and 5-day charts to appear within a 40-day time frame
- Fixed a bug in which cross-hairs showed indicator data rather than price data for mountain and line charts
- Updated SDK documentation is available online: https://www.chartworks.io/Documentation/AndroidSdk
v2.6.0
Released December 2017
New Features
- Added an option to display multiple lower indicators simultaneously in separate charts
- Multiple lower charts are independently resizable by users
- X-axis tick marks and labels may be shown at the bottom of the screen instead of below each chart
- Ping APIs are now supported
Programming Notes
To enable multiple lower charts, call the following method during initialization:
ChartHandler.Builder setMultipleLowerChartsEnabled(boolean isMultipleLowerChartsEnabled);
These configuration options are related to multiple lower charts:
    <bool name="indicatorLowerButtonBarShown">false</bool>
    <bool name="indicatorLowerLegendButtonShown">true</bool>
    <bool name="indicatorPlusButtonShown">false</bool>
To enable a resize gripper using an SDK-provided drawable, call the following method:
ChartHandler.Builder setResizeGripperEnabled(boolean isResizeGripperCentered);
To provide your own drawable for the gripper, add an argument providing the resource ID of an XML or PNG file, e.g. R.drawable.gripper:
ChartHandler.Builder setResizeGripperEnabled(boolean isResizeGripperCentered, int gripperDrawable);
To enable a single, floating x-axis at the bottom of all charts, add this line to the configuration file:
<bool name="enableFloatingXAxis">true</bool>
Other configuration options are related to the floating x-axis:
    <bool name="enableUpperXAxisLegendText">false</bool>
    <bool name="enableUpperXAxisMajorTicks">false</bool>
    <bool name="enableUpperXAxisMinorTicks">false</bool>

    <bool name="enableLowerXAxisLegendText">false</bool>
    <bool name="enableLowerXAxisMajorTicks">false</bool>
    <bool name="enableLowerXAxisMinorTicks">false</bool>
The sample application's dark theme is configured to demonstrate these features.
The sample app now uses Ping APIs for symbol lookup and chart series data. Please refer to the following methods in MainActivity.java for example API code based on the Volley network library:
    JsonObjectRequest getExactRequest(final String symbol);

    JsonObjectRequest getChartDataJSON();
To support this authentication procedure, new methods were added to the ChartDataRequest class:
    public static void setToken(String authToken);

    public static ArrayMap<String, String> getApiHeaders();
The app should define a method to get a valid token; a stub method in the sample app returns the fixed "demo-token" value:
private String getToken();
The value returned by getToken() is passed to setToken() during app initialization. A Volley method is overriden to provide the values to be added to the network header:
    public Map<String, String> getHeaders() throws AuthFailureError {
                return ChartDataRequest.getApiHeaders();
            }
Also, note how the onErrorResponse() methods are coded to call getToken() and retry the request.
v2.5.0
New Features
- New drawing tools
- Fibonacci Arcs
- Fibonacci Circles
- Rays
- Extended lines
- Crosshairs data is now shown for lower indicators
- A gripper button may optionally be added to allow user control of upper/lower chart sizes
- Custom time frames with user-specified start and end dates may be created
- The normalization point optionally remains fixed when pan-loading data while comparing stocks
- Drawings are retained when comparisons are added or removed
Note: for drawings to be retained when comparisons are added or removed, the chart series data service must return a NormalizeValues element when comparison data is requested.
Bug Fixes
- Fixed a client-reported crash that occurred when primary trading session data was not available
- Fixed a client-reported issue involving tickmark labels disappearing after data refresh
- Fixed an intermittent crash that occurred when accessing a time zone data resource on restart
Programming Notes
Configuration options were added to support new drawing tools.
    <!-- Fibonacci Arcs and Circles -->
    <color name="colorFibonacciArcFirstLabel">#F10E1BFF</color>
    <color name="colorFibonacciArcSecondLabel">#E7A82BFF</color>
    <color name="colorFibonacciArcThirdLabel">#2DA732FF</color>
    <color name="colorFibonacciArcFourthLabel">#3A886EFF</color>
    <color name="colorFibonacciArcEndLabel">#777777FF</color>
    <color name="colorFibonacciArcFirstZone">#A92B2155</color>
    <color name="colorFibonacciArcSecondZone">#699C1E55</color>
    <color name="colorFibonacciArcThirdZone">#24B82955</color>
    <color name="colorFibonacciArcFourthZone">#378A6E55</color>
    <color name="colorFibonacciArcFifthZone">#5A5A5A55</color>
    <color name="colorFibonacciArcFirstLine">#F10E1BFF</color>
    <color name="colorFibonacciArcSecondLine">#E7A82BFF</color>
    <color name="colorFibonacciArcThirdLine">#2DA732FF</color>
    <color name="colorFibonacciArcFourthLine">#3A886EFF</color>
    <color name="colorFibonacciArcEndLine">#666666FF</color>
    <bool name="showTrendLineOnFibonacciArc">true</bool>
    <bool name="showPercentagesOnFibonacciArc">true</bool>
    <bool name="showPercentagesAsDecimalsOnFibonacciArc">false</bool>
    <float name="textSizeFibonacciArc">10.0</float>

    <!-- Ray line (width in dp) -->
    <color name="colorRayLine">#7F0F7E</color>
    <float name="widthRayLine">2.0</float>

    <!-- Extended line (width in dp) -->
    <color name="colorExtendedLine">#FEA428</color>
    <float name="widthExtendedLine">2.0</float>
Configuration options were added for crosshairs. Lower chart data is always shown fixed at top center.
    <!--  Crosshair View Colors, etc. (width in dp) -->
    <color name="colorCrosshair">#777777</color>
    <color name="colorCrosshairViewBackground">#EEEEEEDD</color>
    <color name="colorCrosshairViewBorder">#404040DD</color>
    <color name="colorCrosshairViewText">#404040</color>
    <float name="crossHairLineWidth">2</float>
    <bool name="crossHairPositionFixed">false</bool>
If crossHairPositionFixed is true (default false), upper chart crosshair data is shown in a fixed position at top center. In that case, background and border colors as well as outline shape come from an XML shape resource file, either tooltip_background.xml (for light theme) or tooltip_background_dark.xml (for dark theme). This can be overridden with a file by that name in the app's res/drawable folder, such as the following:
<?xml version="1.0" encoding="utf-8"?>
<shape xmlns:android="http://schemas.android.com/apk/res/android">

    <corners
        android:radius="4dp"
        android:topLeftRadius="0dp"
        android:topRightRadius="0dp"/>

    <solid
        android:color="#DDEEEEEE" />

    <stroke
        android:width="1dp"
        android:color="#DD404040" />
</shape>
Note: color specs in the shape drawable have alpha before RGB, e.g. in DDEEEEEE, DD is the alpha component. This differs from other configuration files where the iOS convention of placing alpha at the end is used.
Here are the options for normalization during display of comparisons:
    <!-- Normalization point options -->
    <boolean name="shouldResetNormalizeDateWhenPanning">false</boolean>
    <boolean name="compareZeroBarEnabled">true</boolean>
    <boolean name="disableComparisonVerticalBar">false</boolean>
    <color name="colorSymbolCompareZeroBar">#000000</color>
    <color name="colorComparisonVerticalBar">#000000</color>
    <float name="widthSymbolCompareZeroBar">2.0</float>
    <float name="widthComparisonVerticalBar">2.0</float>
A new color option was necessary to support chart resize grippers:
    <!-- Chart Layout Background (appears in gap between upper and lower charts) -->
    <color name="colorChartLayoutBackgroundColor">#FAFBFC</color>
To enable the chart resizing gripper, use a ChartBuilder method to indicate its position (center or right) and, optionally, supply a drawable to override the gripper provided by the SDK:
chartBuilder.setResizeGripperEnabled(isGripperCentered, R.drawable.gripper);
To create custom time frames, a new constructor and a new method were added to the TimeFrame class; these provide the values needed for the ChartHandler method updateTimeFrameAndFrequency():
    /**
     * Create a custom TimeFrame with the given start and end dates
     * after which, call getFrequencies() for available frequencies
     * @param startDate - start date
     * @param endDate -  end date
     */
    public TimeFrame(Date startDate, Date endDate);

    /**
     * getFrequencies
     * @return - a list of Frequencies available for this TimeFrame
     */
    public ArrayList<Frequency> getFrequencies();

    /**
     * Updates the current timeframe and frequency to use
     * @param timeFrame
     * @param frequency
     */
    public void updateTimeFrameAndFrequency(TimeFrame timeFrame, Frequency frequency);
The sample app includes a new class, CustomTimeFrameFragment, which provides a dialog in which users may enter a start and end date; in this example, the frequency is set automatically. The dialog is shown when users select Custom from the bottom of the sample app's time frame menu.
v2.4.1
New Features
- New lower indicators:
- Bollinger Band %B
- Bollinger Bands Width
- New vertical dividers show date boundaries on 5-day charts
- New drawing tools:
- Draw level line
- Draw text
See the programming notes for configurable elements of these features and other implementation details.
Bug Fixes
- Fixed issues involving removal of Fibonacci Retracement lines and associated text
- Fixed an issue in which the Latest Price indicator didn't appear until after a data refresh
- Fixed an issue causing duplicate events (dividends, earnings, splits) after a data refresh
- Fixed an intermittent crash that could occur after a data refresh
Programming Notes
The following configurable options were added for the new indicators. They are in chartworks_light_theme.xml in the sample app:
    <string name="nameBBandPercentB"><![CDATA[Bollinger Band %B]]></string>
    <string name="nameShortBBandPercentB"><![CDATA[BBand %B]]></string>
    <string name="descriptionBBandPercentB"><![CDATA[BBand %B quantifies a security's price relative to the upper and lower Bollinger Band.]]></string>
    <string name="textBBandPercentBOverbought"><![CDATA[Overbought]]></string>
    <string name="textBBandPercentBOversold"><![CDATA[Oversold     ]]></string>

    <color name="colorBBandPercentBLine">#FF8C00</color>
    <color name="colorBBandPercentBMedianLine">#4682b4</color>
    <color name="colorBBandPercentBOversoldLine">#228b22</color>
    <color name="colorBBandPercentBOverboughtLine">#228b22</color>

    <string name="nameBBandsWidth"><![CDATA[Bollinger Bands Width]]></string>
    <string name="nameShortBBandsWidth"><![CDATA[BBands Width]]></string>
    <string name="descriptionBBandsWidth"><![CDATA[Bollinger Bands Width is a measure of volatility. It is calculated by subtracting the lower band's price from the upper band and dividing the result by the middle band.]]></string>

    <color name="colorBBandsWidthLine">#FFCB6A</color>
To enable the new lower indicators, call:
    chartHandler.setIndicatorIsActive("percentB", true);
    chartHandler.setIndicatorIsActive("bollingerbandwidth", true);
Vertical dividers now appear by default at date boundaries in intraday charts, including 5-day charts. The following configuration options were added:
    <boolean name="showDateDividers">true</boolean>
    <color name="colorDateDividers">#C8C9CA</color>
Implementation of the Draw Text feature requires a text entry dialog in the app as well as a resource for text backgrounds. The sample app provides this implementation using the following files:
- TextAnnotationDialogFragment.java -- the dialog into which users enter text to be shown on the chart
- TextAnnotationInterface.java -- methods the dialog calls, which the app activity implements
- text_annotation_layout.xml -- layout of the dialog
- text_annotation_background.xml -- drawable which defines the background and border color for text shown on the chart
The app needs to implement the following methods; see MainActivity.java in the sample app for details:
    void textAnnotationCreated();                   // called when the app should show the text entry dialog
    void addTextAnnotation(String annotationText);  // called after the user enters text and clicks OK
    void cancelTextAnnotation();                    // called if the user cancels the dialog
In the body of addTextAnnotation(), the app should call the drawTextAnnotation() SDK method to draw the text, providing arguments that style the annotation:
    /**
     * Draw a text annotation
     * @param annotationText - The text to place in the annotation
     * @param textSize - The text size in scaled pixels
     * @param textColorSpec - The text color spec in the form #RRGGBB
     * @param backgroundResource - The ID of a drawable resource specifying border width, border color, and background color
     * @param maxWidthDp - The maximum width of the TextView in dp - text will automatically wrap as needed
     */
    public void drawTextAnnotation(String annotationText, float textSize, String textColorSpec, int backgroundResource, float maxWidthDp);
In the body of cancelTextAnnotation, the app should call the endAnnotationMode() SDK method so later taps do not trigger the textAnnotationCreated() callback.
    /**
     * End text annotation mode
     */
    public void endAnnotationMode();
v2.4.0.2
Bug Fixes
- Fixed a client-reported issue which caused an API error after adding an indicator
- Fixed an issue causing gaps in lower indicators for symbols with shorter history than requested
v2.4.0.1
Bug Fixes
- Fixed a client-reported crash in showLoading
v2.4.0
New features
- New Lower indicator: Awesome Oscillator
- New chart styles: HLC style, Dot style
- Linear Regression line is now dynamically updated as chart is panned
- Zoom out to load data was implemented
- Pan to load data was redesigned to improve gesture recognition and responsiveness
- A built-in loading progress spinner now shows when the chart is updating
- X-Axis tick mark labels for hours now use a more compact format, e.g. "10 AM"
- An updated graphics library is incorporated, Shinboi v. 1.9.2
Bug Fixes
- Fixed a client-reported issue with X-axis tick mark labels
- Fixed an issue involving comparison data with time zone normalization off
- Fixed issues causing a crash in the sample app
- Fixed an issue causing X-axis tick mark labels to overlap when crosshairs were shown
- Fixed an issue causing a crash when the application was restarted from background
Programming Notes
Please update the dependencies in your build gradle file and copy the new shinobi library files to the libs folder:
compile(name: 'shinobicontrols-android-charts-premium-java-1.9.2-0', ext: 'aar')
New configurable options were added. These may be overridden (in chartworks_light_theme.xml):
    <boolean name="showLoadingProgress">true</boolean>

    <string name="nameAwesomeOscillator"><![CDATA[Awesome Oscillator]]></string>
    <string name="nameShortAwesomeOscillator"><![CDATA[AWES OSC]]></string>
    <string name="descriptionAwesomeOscillator"><![CDATA[Awesome Oscillator measures short-term momentum in a security. It is displayed as a histogram of the difference between two simple moving averages of the midpoints of each period's prices.]]></string>
    <color name="colorAwesomeOscillatorUp">#339F39</color>
    <color name="colorAwesomeOscillatorDown">#CC3333</color>

    <color name="colorStyleDot">#0067C6</color>
    <number name="radiusDot">4</number>         <!-- dot radius in dp -->

    <bool name="shouldLoadDataOnZoomOut">true</bool>

    <string name="hourFormat"><![CDATA[h a]]></string>
To enable the new Awesome Oscillator indicator in the lower chart, call:
chartHandler.setIndicatorIsActive("AwesomeOscillator", true);
To use one of the new chart styles for prices, make one of the following calls:
    chartHandler.switchChartStyle(ChartStyle.Dot);

    chartHandler.switchChartStyle(ChartStyle.HLC);
v2.3.1.1
Bug Fixes
- Fixed a reported issue in which indicators added to a chart did not appear because data for them was not loaded.
v2.3.1
Bug Fixes
- Fixed a reported issue in which 1-day charts are not displayed between 9.45 and 9.50 AM ET (see Programming Notes)
- Fixed a reported issue in which all the trendlines are removed instead of just the last one
- Fixed a reported issue in which a symbol briefly is displayed twice in the upper chart legend
- Fixed a reported issue in which returns calculator dates are cut off in landscape mode
- Fixed an issue in which the last quote of day was not shown on 1-day or 5-day charts
- Fixed an issue causing X-Axis tickmark labels to overlap after a style change while zoomed in
- Fixed an issue in which 30-minute charts showed 15-minute data
- Fixed an issue in which changing a comparison symbol to the primary symbol results in an inconsistent state
- Fixed an issue in which the Y-axis tickmark labels in a comparison chart may show incorrect percentages
- Fixed an issue causing blank x-axis labels while zooming
- Fixed an issue in which comparison data may not appear if timezone normalization is disabled
- Fixed an issue in which autoloading data may cause x-axis label overlap
- Fixed a crash in the sample app that occurs when quote lookup fails
- Fixed a crash in the sample app when the Theme menu option is selected after rotation
Programming Notes
- To improve performance, indicator data is loaded only for enabled indicators. As a consequence,
the following method has no effect when the "active" argument is false:
public Builder addUpperIndicator(UpperIndicator upperIndicator, boolean active)public Builder addLowerIndicator(LowerIndicator lowerIndicator, boolean active, boolean selected) - New configuration options were added to control fetching of yesterday's data for 1-day charts shortly after opening.
If enabled, a 2-day chart is requested when today's data includes fewer than a specified number of data points.
The default configuration options enable this feature and specify a minimum of 12 data points for a 1-day chart:
  <boolean name="isMinOneDayDateCountEnabled">true</boolean>
  <int name="minOneDayDateCount">12</int>
v2.3.0.1
Bug Fixes
- Fixed a bug in which chartDrawn was not called if the lower chart was disabled
v2.3.0
New features
- Improved performance of chart drawing when comparisons are added to upper chart
- Added an optional parameter, isDataRequested, to removeAllComparisons method (see programming notes)
- Added an optional method to set the SDK logging level (see programming notes)
- Added a Remove All Comparisons menu option to the sample app.
Bug Fixes
- Corrected logic which caused the chartDrawn callback to occur before drawing was finished, which could result in a busy indicator being removed too early
- Fixed a crash in the sample app that occurred when the device was rotated while the timeframe menu was displayed
- Fixed an intermittent crash in the SDK on rotation
- Fixed a crash in which a Parcelable encountered an IOException when the device Home button was pressed while Latest Price was displayed
- Fixed a bug causing comparison lines to be hidden behind mountain-style charts
- Fixed a bug preventing the zero line in comparison charts from being visible
Programming Notes
- The ChartHandler interface now includes a new method:
public void removeAllComparisons(boolean isDataRequested);
If isDataRequested is false, updateChartDataRequest() is not called after comparisons are removed. This improves performance if the app will be calling setMainIssueID() or addComparisons() immediately afterward.
- The ChartHandler.Builder interface now includes a new, optional method:
    public Builder setLogLevel(ChartHandler.LogLevel logLevel);

    public enum ChartHandler.LogLevel {
        None,       // default
        Error,
        Warn,
        Info
    }
For example, the following will allow logs to report Info, Warn, or Error:
chartBuilder.setLogLevel(ChartHandler.LogLevel.Info);
By default, the log level is set to None. If set to Info, public methods in the SDK are logged.
v2.2.15
Bug Fixes
- Fixed overlapping time of day labels on X-Axis
- Fixed intermittent crash caused by IndexOutOfBoundsException
- Fixed intermittent crash in returns Calculator
v2.2.14
- Returns Calculator implemented for two-finger press-and-hold gesture
- Improved performance of chart loading
Bug Fixes
- Fixed alignment of volume indicator bars with X-axis tickmarks
Programming Notes
The Returns Calculator may optionally be customized with the following configuration options. The defaults are:
  <boolean name="disableReturnsGesture">false</boolean>
  <color name="colorReturnsCalculatorRising">#00FF00</color>
  <color name="colorReturnsCalculatorFalling">#FF0000</color>
  <color name="colorReturnsCalculatorNoChange">#888888</color>
  <color name="colorReturnsCalculatorForeground">#111111</color>
  <color name="colorReturnsCalculatorBackground">#f7f7f7</color>
  <color name="colorReturnsCalculatorText">#111111</color>
  <float name="returnsYPositionPercentage">0.5</float>
  <float name="returnsCalculatorTextSize">12.0</float>
If disableReturnsGesture = true, the feature is turned off.
- colorReturnsCalculatorRising is the color of the lines on either side when the price is rising
- colorReturnsCalculatorFalling is the color of the lines for falling prices
- colorReturnsCalculatorNoChange is the color of the lines for unchanged prices
- colorReturnsCalculatorForeground specifies the color of the box outline
- colorReturnsCalculatorBackground specifies the background color inside the box
- colorReturnsCalculatorText specifies the text color
- returnsYPositionPercentage positions the box: 0.0 at top, 1.0 at bottom
- returnsCalculatorTextSize is the size of text
v2.2.13
Bug Fixes
- Fixed overlapping dates and times in X-Axis legends
- Fixed problems comparing securities traded in different time zones
- Fixed issues involving 1- and 5-day charts
- Fixed crash involving IllegalStateException
Programming Notes
- Logs warning of invalid calls to addComparer were reworded for clarity and changed to errors
v2.2.12
Bug Fixes
- ShinobiControls library update fixes crash in older Samsung devices
- Fixed crash that can occur when a comparison is removed after the device is rotated
- Fixed crash that can occur when app is brought to foreground after a prolonged period in background
- Improved reliability of getChartDataRequest method by reporting additional types of errors in onApiError
Programming Notes
- Please integrate ShinobiControls library files for the 1.9.1 release, replacing the 1.9.0 versions:
shinobicontrols-android-charts-premium-java-1.9.1-0.aar shinobicontrols-android-charts-premium-java-1.9.1-0.pom - Note that the Error class used as an argument to onApiError has new constants to assist in debugging issues causing
chart drawing to fail due to missing data in the chart data request. Errors are logged as well as being reported via
the onApiError callback.
  public static final int BAD_REQUEST = 400;
  public static final int MISSING_ELEMENTS = 401;
  public static final int MISSING_TIMEFRAME = 402;
  public static final int EXCEPTION = 403;
v2.2.11
Bug Fixes
- Fixed a bug affecting display of X-Axis legends after scrolling
- Performance of comparisons was improved by eliminating a redundant network data request
- Performance on rotation was improved by redrawing the charts without reloading data from network
v2.2.10
Bug Fixes
- Fixed crash due to IllegalStateException: Chart must have an X Axis and a Y Axis to draw a Series
v2.2.9
Bug Fixes
- Fixed crash due to IllegalArgumentException: Cannot set a default range with equal minimum and maximum values
v2.2.8
Bug Fixes
- Fixed crash due to ConcurrentModificationException
- Redundant chart data lookup fixed in Sample App (see Programming Notes)
Programming Notes
- The sample app method getSymbolRequest was modified to move getChartData() inside an if(getMainSymbol) conditional -- this change prevents two chart data lookups occurring when a comparison symbol is added, since updateChartDataRequest() also calls getChartData().
v2.2.7
Bug Fixes
- Fixed display of events (earnings, dividends, splits and high/low)
- Fixed issue in which NIKKEI 225 Index was displayed twice
- Fixed issue causing "No information available" message
- Fixed issue in which MACD Option was not selected
- Fixed crash serializing lower indicator
v2.2.6
Bug Fixes
- Added code to prevent a crash in buildIntradayXAxis due to null session hours
- Corrected 1-day chart's X-axis legend so hours are shown initially
v2.2.5
Bug Fixes
- Updated joda-time library to ensure compatibility with Android 4.x
- Fixed a possible crash when no lower indicator is set
Programming Notes
- Change the dependencies section of your app's build.gradle file:
remove:
compile 'joda-time:joda-time:2.9.4'
add:
compile 'net.danlew:android.joda:2.9.5.1'
- Change your class that extends Application to instead extend MultiDexApplication
- In that class override a method as follows:
    @Override
    protected void attachBaseContext(Context base) {
        super.attachBaseContext(base);
        MultiDex.install(this);
    }
v2.2.4
Bug Fixes
- Fixed TransactionTooLargeException affecting Android 7.0 devices
- Fixed crash due to IllegalArgumentException: Cannot add/set a null axis to the chart
v2.2.3
Bug Fixes
- Fixed error causing "No information found" for chart
- Fixed a problem causing lower chart to disappear on refresh
- Corrected automatic decimal digits of numbers in Y-Axis legend
- Fixed a crash due to null Session
- Fixed a crash due to null Context
v2.2.2
New Features
- Added an error-handling callback method, onApiError
Bug Fixes
- Improved error handling when issue ID has not been set
- Added defensive code to prevent IllegalStateException when setting skip ranges on X axis
- Added defensive code to prevent IllegalArgumentException when setting skip ranges on X axis
- Added defensive code to prevent NullPointerException during X axis initialization
Programming Notes
You'll need to implement the new onApiError method in the class which implements ChartViewIndicatorListener. See the Getting Started Guide section, "Handling Errors," for details. The sample app includes code for this method which logs errors.
v2.2.1
New features
- Configuration options for interactivity of upper and lower legends (button bars)
See Getting Started Guide, "Customize to remove interactivity of a legend"
Bug Fixes
- Fixed crash due to ConcurrentModificationException
- Fixed crash in onCancelled due to NullPointerException
- Fixed X-Axis time overlapping
- Fixed X-Axis values not displayed
- Fixed X-Axis year value (off by one) for multi-year charts
- Fixed Y-Axis value that showed extra "K"
v2.2.0
New features
- getActiveUpperIndicators now returns a typed indicator
- new onNetworkError method allows app to inform SDK of network errors
- drawCharts method no longer throws exceptions
Bug Fixes
- Fixed crash in Draw Trendline
- Fixed crash when app is placed in background
Programming Notes
Since the drawCharts method no longer throws exceptions, the try/catch blocks for DrawingException and JSONException surrounding drawCharts should be removed.
Revised return types:
ArrayList<Indicator<UpperIndicator>> getActiveUpperIndicators();
ArrayList<Indicator<LowerIndicator>> getActiveLowerIndicators();
New method:
/**
 * Call when network request failed
 * @param statusCode - app-defined error code
 * @param message - error message
 */
void onNetworkError(int statusCode, String message);
Note: a demo chart data API URL is now specified in the SDK and sample app. It supports only two symbols: AAPL and MSFT. To access production chart data, specify the production chart data API URL in a string named "chart_api" in the strings.xml file of your app. Please obtain the appropriate URL from your Markit project manager or technical contact.
v2.1.1
New features
- Static References removed
- You can now control the legend column width via the dimensions folder
- You can now left, center, and right align the legend items.
- Tick marks have been redesigned with a better algorithm taking into account the width of chart.
v2.1.0
New features
- Added a addComparisons method to add multiple comparisons at once
- Added removeAllComparisons method to remove all comparisons at once.
- Added a new Object Comparison to use for adding and removing comparisons.
Bug Fixes
- Removing comparisons via the chartHandler API now works correctly.
- The allowBackup issue has been resolved by not setting the allowBackup in the SDK manifest.
- The Price Indicator is always the first indicator in the legend.
- Fixed an issue where the weeks where showing inconsistent gaps on tick marks on the x-axis.
- Added Defensive coding around chartStyle switching to prevent a catch
- Defensive coding around canceling an Async Task that was causing a crash.
v2.0.0
New features
- Updated to disable lower chart via config or Java method
- Allow overriding the price display.
- Show Path or Hostname for api