HTML5 Charts
Versatile across devices, data included
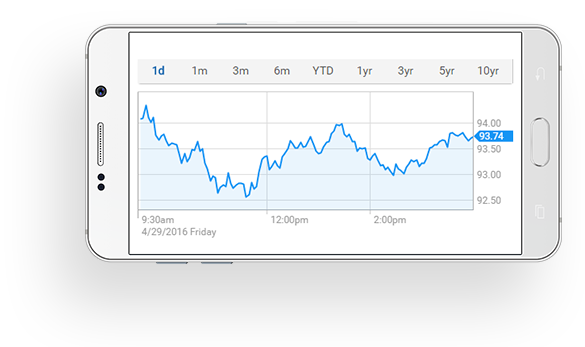
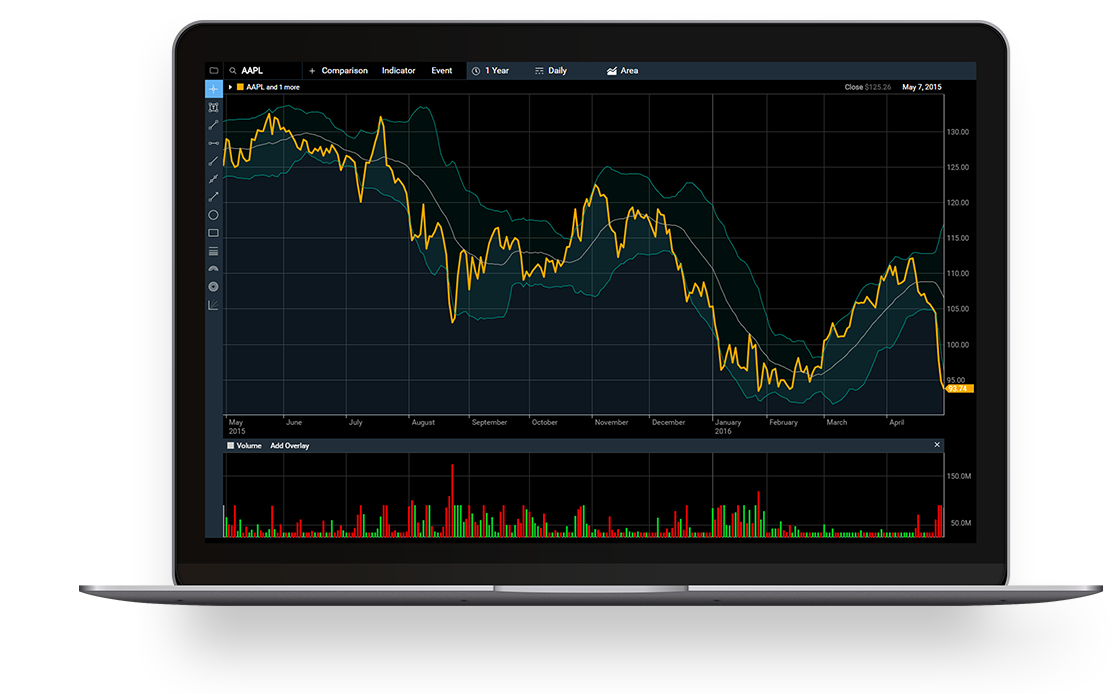
Our responsive HTML5 charts allow you to easily add robust interactive financial charts to your platform with just a few lines of JavaScript; institutional grade data included.
Highlights
- Responsive layout, great for desktop, tablet and phone
- Fluid panning and zooming of all chart data (including all indicators)
- Smart, dynamic X and Yaxis labels when panning and zooming
- Full suite of upper and lower indicators
- Extensive drawing and annotation tools
- Saving and loading of chart templates
Try it out View Data Table Full Screen
Code Sample
This code sample shows a simple implementation of the HTML5 charts using the bare minimum needed to render a chart.
Have a look at the documentation for more live demos as well as the full list of chart inputs and options.
View Documentation<!DOCTYPE html>
<html>
<head>
<style>
.chart { height: 440px; }
</style>
</head>
<body>
<!-- Target where HTML5 chart will load -->
<div id="chart-target"></div>
<!-- Add Chartworks script -->
<script src="https://www.chartworks.io/content/chartworks/dist/latest/js/chartworks.min.js"></script>
<!-- Chartworks config -->
<script type="text/javascript">
new ChartworksBuilder({
"exchange": "NSQ",
"symbol": "AAPL",
"target": "#chart-target",
"token": "demo-token"
});
</script>
<noscript>Please enable Javascript</noscript>
</body>
</html>
Chart Features
Lower Indicators
- Accumulation Distribution Line
- Average True Range
- Bollinger Bands Width
- Bollinger Band %B
- Chaikin's Volatility
- Dividend Yield
- Directional Movement Index (DMI)
- Historical Dividend
- MACD
- Mass Index
- Momentum
- Money Flow
- Money Flow Index
- On Balance Volume
- Price Rate of Change (PROC)
- Relative Strength Index (RSI)
- Fast Stochastics
- Slow Stochastics
- Ultimate Oscillator
- Volume
- Volume Rate of Change (VROC)
- Williams %R
Upper Indicators
- Bollinger Bands®
- Exponential Moving Average (EMA)
- High/Low Price
- Ichimoku Cloud
- Linear Regression
- Moving Average Envelope
- Price Channel
- Parabolic Stop and Reversal (PSAR)
- Simple Moving Average (SMA)
- Time Series Forecast
- Volume by Price
- Weighted Moving Average (WMA)
Events
- Dividends
- Splits
- Custom Events
Sharing
- Share 'live' charts
Drawing Tools
- Text on chart
- Trend Line
- Horizontal Trend Line
- Ray
- Arrow Line
- Extended Line
- Ellipse
- Rectangle
- Fibonacci Retracement
- Fibonacci Arc
- Fibonacci Circle
- Gann Fan
Language Support
- English (United States)
- English (Australia)
- English (United Kingdom)
- French (Canada)
- Japanese (Japan)
- Italian (Italy)