iOS / Android SDK
Interactive charts for your mobile app, data included
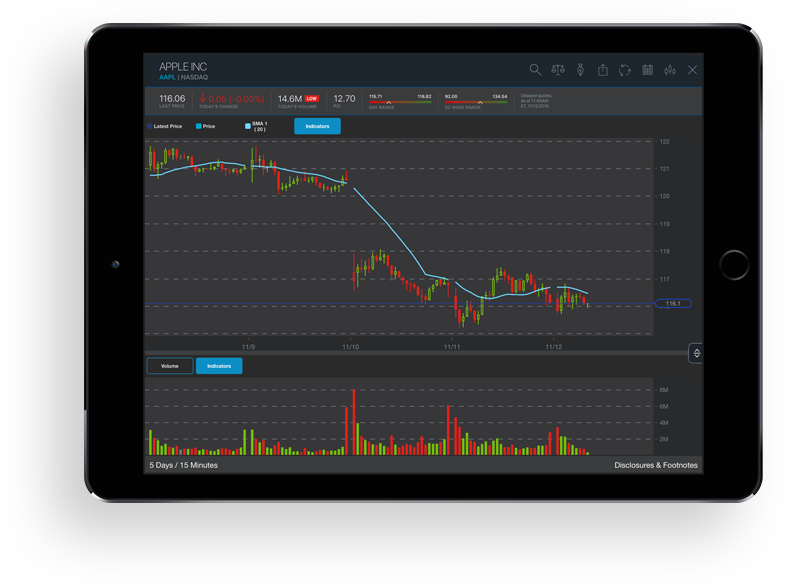
Our iOS and Android charting SDKs help us quickly add interactive charting experiences to your iOS or Android app. We can style the appearance of our advanced charts to match your theme, whether integrating them into your existing UI or customizing our quick-start UI. Just like the rest of our charts, our SDKs also come with institutional grade data included.
Highlights
- Easily add an interactive chart of nearly any size to your existing apps
- Heavily customizable, create your own theme for your chart
- Pinch, Zoom, Hold and Pan anywhere within a chart
- Smart, dynamic X and Y axis labels when panning and zooming
- Full suite of upper and lower indicators
- Symbol Comparisons
- Save and load a chart template
- Multi-touch Data Crosshairs and Change Calculator
- Platform-native quick-start UI option for full-screen charts
Chart Features
Lower Indicators
- Accumulation Distribution Line
- Average True Range
- Chaikin's Volatility
- Dividend Yield
- Directional Movement Index (DMI)
- Historical Dividend
- MACD
- Mass Index
- Momentum
- Money Flow
- Money Flow Index
- On Balance Volume
- Price Rate of Change (PROC)
- Relative Strength Index (RSI)
- Fast Stochastics
- Slow Stochastics
- Ultimate Oscillator
- Volume
- Volume Rate of Change (VROC)
- Williams %R
Upper Indicators
- Bollinger Bands®
- Exponential Moving Average (EMA)
- High/Low Price
- Ichimoku Cloud
- Linear Regression
- Moving Average Envelope
- Price Channel
- Parabolic Stop and Reversal (PSAR)
- Simple Moving Average (SMA)
- Time Series Forecast
- Volume by Price
- Weighted Moving Average (WMA)
Events
- Dividends
- Splits