iOS SDK Documentation
iOS SDK - v3.1.x
Current Version
Released April 2017
v3.1.0 is the current stable release.
What's New
Extended Hours
You can now see trading data outside of normal trading hours.
- Limited to equities on US exchanges only
- Style options including: divider lines, shading, text, or just the data
More information on Extended Hours below.
Lower Chart Overlays
Lower indicators now support overlays including:
- Linear Regression
- Simple Moving Average (SMA)
- Exponential Moving Average (EMA)
- Weighted Moving Average (WMA)
- Moving Average Envelope (MAE)
- Bollinger Bands
See more below
Improvements / Changes:
Linear Regression will now update with the data that is on the screen
- As you pan and scroll the linear regression will recalculate using the data on the screen
- This also applies to linear regression used in overlays
Annotations will now normalize along with the chart
- When switching from price to percent for the Y-Axis, annotations will switch as well
The original -getChartSettings method has been replaced and there are now more options when saving a chart
- -getChartSettingsForTemplate is intended to save a user's preferences
- -getChartSettingsForSave saves an exact chart
- -getChartSettingsWithOptions lets you specify exactly which parts of a chart's settings to save
Bug Fixes
- Improve candlestick appearance when using some symbols, especially XAO in Australia
- Reduced white space surrounding lower chart annotations.
Also see the Change Log for more information on previous versions.
Introduction
In general terms an SDK is a reusable software platform used to develop applications, products and solutions. SDKs contain examples, documentation, code libraries and application programming interfaces (APIs) that bring together all the different components that enable development of a project or solution. ChartworksKit is Markit Digital's iOS SDK that allows developers to easily add and customize interactive pinch & zoom financial charting into a new or existing iOS application.
Authentication
Before jumping into the Quick Start guide make sure you understand Authentication. In the below examples we will be using demo-token as our demo authentication token. This token is a required input into the configuration object. Details on how to generate a real authentication token can be found in the Authentication section. Our demo-token is only entitled for delayed data for the following securities:
- Apple Inc (symbol: AAPL) trading on the NASDAQ
- IHS Markit (symbol: INFO) trading on the NASDAQ
Requests to chart any other securities will fail.
Requirements
- Software: iOS 8.x or later
- Hardware: iPad 4 or later, iPhone 4s or later
Package Contents
The release package contains the following files:
- Demo Apps: an example applications showing the use of the iOS SDK (comes with the SDK)
- Xcode Documentation
- ChartworksKit.framework file: iOS SDK framework (includes header and library)
Frameworks
Our SDK requires the following frameworks and files to be added to your project:
- ChartworksKit.framework
- ShinobiCharts.framework
- QuartzCore.framework
- OpenGLES.framework
- libc++.dylib (for Swift, this is libc++.tbd)
- ChartworksKit.bundle (found inside the ChartworksKit.framework, but it needs to be added separately)
- MKTSymbolLookup.framework
- CWKView+SymbolLookup.h/m
The iOS SDK is ARC compliant.
The package has been tested on Xcode 7.3.1 and supports iOS 8.0 and up.
Quick Start
Example Code
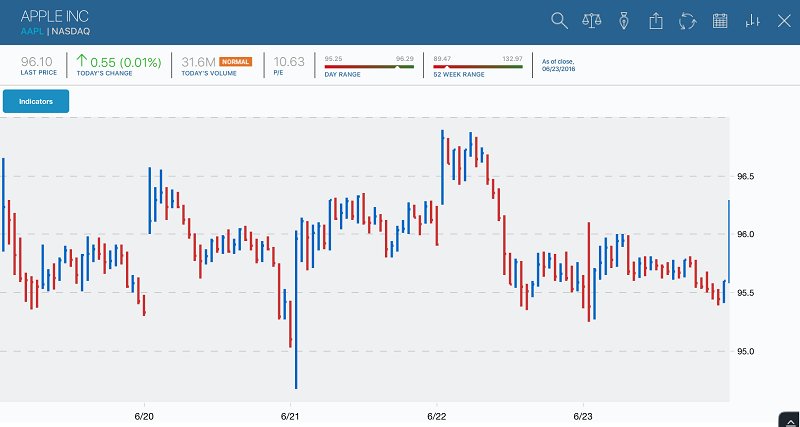
The distribution comes with two starter view controller classes (one Swift, one Objective-C) named SimpleViewController. Either controller can be used as the initial view controller for a project and it will display a three-month chart for Apple (AAPL).
The SDK comes complete with two example applications (one Swift, one Objective-C) that are completely functional where you can see the entire SDK in operation. Use either as a guide when you want to see how a specific design pattern works.
In Swift,
import UIKit
import ChartworksKit

class ViewController: UIViewController, CWKErrorReporterDelegate {

    var chart: CWKView?

    // =================================================
    // MARK: ViewController overrides
    // =================================================

    override func viewDidLoad() {
        super.viewDidLoad()

        // Set error report delegate so we can see messages from the chart
        CWKErrorReporter.setErrorReporterDelegate(self)

        // create our configuration object and set URL and auth token
        let configuration = CWKConfiguration()
        configuration.apiURLChart = "https://api.markitondemand.com/apiman-gateway/MOD/chartworks-data/1.0/chartapi/series"
        configuration.apiURLTranslation = "https://api.markitondemand.com/apiman-gateway/MOD/chartworks-xref/1.0/xref/exact"
        configuration.apiAuthToken = "demo-token"
        configuration.indicatorPlusButtonShown = false

        let gutterHeight: CGFloat = 6.0
        let availableHeight = self.view.bounds.size.height - gutterHeight
        let lowerHeight = availableHeight * 0.33

        let chart = CWKView (frame: self.view.bounds, lowerChartHeight: lowerHeight, configuration: configuration)
        chart.gutterHeight = gutterHeight

        chart.autoresizingMask = [.flexibleHeight, .flexibleWidth]
        self.view.addSubview(chart)
        self.chart = chart

        // set chart style
        chart.chartStyle = .line

        // set indicators active
        chart.setUpperIndicatorActive(.latestPrice)
        chart.setLowerIndicatorActive(.volume)
        chart.setOverlayIndicatorActive(.smaFirst, on: .volume)

        // create a symbol object for the instrument we want to chart
        let baseSymbol = CWKSecuritySymbol(symbol:"AAPL", color:self.chart!.configuration.colorStyleLine)
        baseSymbol.exchange = "NSQ"

        // and a comparison
        let compareSymbol = CWKSecuritySymbol(symbol:"INFO", color:self.chart!.configuration.colorSymbolCompare1)
        compareSymbol.exchange = "NSQ"

        // setup symbol, timeframe, comparisons
        chart.buildChartRequestWithIssueIDLookupsForSymbol(withExchange: baseSymbol,
                compareWithSymbolsWithExchange: [compareSymbol],
                durationAmount: .duration5Day,
                atDataFrequency: .frequency15Minutes,
                translationParameters: nil,
                completion: { (request, response, error) in
                 if (error == nil) {
                     self.chart?.drawCharts()
                 }
        });
    }

    override var prefersStatusBarHidden : Bool {
        return true
    }

    // =================================================
    // MARK: CWKErrorReporterDelegate
    // =================================================

    func chartErrorReceived(_ error: Error) {
        print(error)
    }

}
or in Objective-C,
#import "ViewController.h"
#import "CWKView+SymbolLookup.h"
#import <ChartworksKit/ChartworksKit.h>

@interface ViewController() <CWKErrorReporterDelegate>

@property (strong, nonatomic) CWKView *chart;

@end

@implementation ViewController

// =================================================
#pragma mark - ViewController overrides
// =================================================

- (void)viewDidLoad
{
    [super viewDidLoad];

    // Set error report delegate so we can see messages from the chart
    [CWKErrorReporter setErrorReporterDelegate:self];

    // create our configuration object and set URL and auth token
    CWKConfiguration *configuration = [CWKConfiguration new];
    configuration.apiURLChart = @"https://api.markitondemand.com/apiman-gateway/MOD/chartworks-data/1.0/chartapi/series";
    configuration.apiURLTranslation = @"https://api.markitondemand.com/apiman-gateway/MOD/chartworks-xref/1.0/xref/exact";
    configuration.apiAuthToken = @"demo-token";
    configuration.indicatorPlusButtonShown = NO;

    CGFloat gutterHeight = 6.0;
    CGFloat availableHeight = self.view.bounds.size.height - gutterHeight;
    CGFloat lowerHeight = availableHeight * 0.33;

    CWKView *chart = [[CWKView alloc] initWithFrame:self.view.bounds
                                         lowerChartHeight:lowerHeight
                                            configuration:configuration];
    chart.gutterHeight = gutterHeight;
    chart.userInteractionEnabled = YES;
    chart.autoresizingMask = UIViewAutoresizingFlexibleWidth | UIViewAutoresizingFlexibleHeight;
    [self.view addSubview:chart];
    self.chart = chart;

    // set chart style
    self.chart.chartStyle = CWKStyleLine;

    // set indicators
    [self.chart setUpperIndicatorActive:CWKUpperIndicatorLatestPrice];
    [self.chart setLowerIndicatorActive:CWKLowerIndicatorVolume];
    [self.chart setOverlayIndicatorActive:CWKUpperIndicatorSMAFirst onLowerIndicator:CWKLowerIndicatorVolume];

    // create a symbol object for the instrument we want to chart
    CWKSecuritySymbol *baseSymbol = [[CWKSecuritySymbol alloc] initWithSymbol:@"AAPL" color:self.chart.configuration.colorStyleLine];
    baseSymbol.exchange = @"NSQ";

    // add a comparison
    CWKSecuritySymbol *comparisonSymbol = [[CWKSecuritySymbol alloc] initWithSymbol:@"INFO" color:self.chart.configuration.colorSymbolCompare1];
    comparisonSymbol.exchange = @"NSQ";

    // setup symbol, timeframe, comparisons
    [self.chart buildChartRequestWithIssueIDLookupsForSymbolWithExchange:baseSymbol
        compareWithSymbolsWithExchange:@[comparisonSymbol]
                        durationAmount:CWKDuration5Day
                       atDataFrequency:CWKFrequency15Minutes
                 translationParameters:nil
                            completion:^(NSURLRequest *request, MKTSLExchangeSymbolResponse *response, NSError *error) {
                                if (!error) {
                                    // call draw charts which will trigger data to be requested and drawn
                                    [self.chart drawCharts];
                                }
                                else {
                                    NSLog(@"Problem with symbols = %@", error);
                                }
                            }];
}

- (BOOL)prefersStatusBarHidden
{
    return YES;
}

// =================================================
#pragma mark - CWKErrorReporterDelegate
// =================================================

- (void)chartErrorReceived:(NSError *)error
{
    NSLog(@"Error from chart: %@", error);
}

@end
The chart is fully navigable. By pinching and spreading two fingers you can zoom out and zoom in, allowing you to see additional details. You can also use a gesture to pan the chart left and right. Pressing and holding a tap will show cross hairs and reveal the point value underneath. For more details and a more robust example, please go to the demo app you received with the SDK.
Data Networking
To avoid conflicts with your own application networking, and to support those clients who wish to log all network traffic, the SDK can delegate network calls to your application. The SDK uses the following delegate method to request data:
- (void)chartView:(CWKView *)chartView performNetworkOperationForURL:(NSURLRequest *)request onCompletion:(void (^)(NSData *, NSError *))onCompletion
The request will include the URL which contains all necessary information to communicate with the Markit Digital Servers. Developers can submit this URL to their own network code and once a return is received simply pass the response back.
Installation
Be sure you have the frameworks above set up in your project prior to trying these steps. Make sure they are included in your target's Link Binary With Libraries build phase. To get a basic chart up and running:
- Make sure to add the -Objc flag to Other Linker Flags in the project's build settings.
- Drag the ChartworksKit.bundle file from the .framework file into the project navigation pane.
- Open your own ViewController where you want to add the chart view and import the framework.
- Set your view controller to conform to protocols:
- NSURLSessionDelegate
- CWKViewDataSource
- CWKViewDelegate
- CWKErrorReporterDelegate.
- Set your view controller as the delegate for:
- CWKViewDataSource
- CWKViewDelegate
- CWKErrorReporterDelegate.
- Establish the configuration.
- Establish the chart and symbol information URLs. (This is a necessary step, failure to do so will cause the framework to stop with an assertion.)
- Create the chart view.
- Build the chart request.
- Call the drawCharts method.
Chart Lifecycle
The steps to create a chart in the app are:
- The app creates a configuration to specify the style and behavior of the chart.
- The app creates a chart view with the configuration, and adds it to its view hierarchy.
- The app calls buildChartRequest to specify symbol, timeframe, and comparison symbols.
- The app calls drawCharts to trigger data loading.
- The network request is made through the chart's built in networking or app's networking.
- The chart validates the network response. In the case of an error, an error message is shown on the chart view.
- The chart redraws with the new data.
- Steps 3-7 are repeated as needed to change the symbol, comparisons, or timeframes.
Detailed Setup
Configuration
In order to create a chart with data, you need to set the chart and the information about the chart. There are two methods you need to set before you begin:apiURLChart
Pass in the api URL for the chart. If this is left unassigned then on the first drawChart an error will be generated.
In Swift,
configuration.apiURLChart = "https://api.markitondemand.com/apiman-gateway/MOD/chartworks-data/1.0/chartapi/series"
In Objective-C,
configuration.apiURLChart = @"https://api.markitondemand.com/apiman-gateway/MOD/chartworks-data/1.0/chartapi/series";
apiAuthToken
This takes in the authorization token to allow access to the API. This must be declared or the chart will not work.
In Swift,
configuration.apiAuthToken = "demo-token"
In Objective-C,
configuration.apiAuthToken = @"demo-token";
For more details about creating and initializing configuration, please go to the App Docs.
Set Initial Chart Object
To set the initial chart object, you need to set the position, height of the upper chart, and add your chart to the view. A lower chart can also be added (but it is not required) and a gutter height between the two charts. Below is an example of the code in both Swift and Objective-C:In Swift,
let chart = CWKView (
            position: CWKPosMake(0, 0, self.view.bounds.size.width),
            upperChartHeight: upperHeight,
            lowerChartHeight: lowerHeight,
            gutterHeight: gutterHeight,
            configuration: configuration
        )
In Objective-C,
  CWKView *chart = [[CWKView alloc] initWithPosition:CWKPosMake(0, 0, self.view.bounds.size.width)
                                    upperChartHeight:upperHeight
                                    lowerChartHeight:lowerHeight
                                        gutterHeight:gutterHeight
                                       configuration:configuration]
Menus
All the menus for the mobile charts are completely customizable. You can decide what features you want to have accessible to the user and how you want the menu to look. There are a few important methods to activate and deactivate upper and lower indicators to create a custom menu.setAllUpperIndicatorsInactive
void: required
Description: De-activates all upper indicators. It is not necessary to make a call to drawCharts after this method.
setAllUpperIndicatorsActive
void: required
Description: Activates all upper indicators. It is not necessary to make a call to drawCharts after this method. This is usually intended for debug purposes.
getActiveUpperIndicators
NSArray: required
Description: Gets a list of enabled upper indicators.
Return Value: A list of UpperIndicator types wrapped in NSNumber that are currently set to active
setAllLowerIndicatorsInactive
void: required
Description: De-activates all lower indicators. It is not necessary to make a call to drawCharts after this method.
setAllLowerIndicatorsActive
void: required
Description: Activates all lower indicators. It is not necessary to make a call to drawCharts after this method. This is usually intended for debug purposes.
getActiveLowerIndicators
NSArray: required
Description: Gets a list of all enabled lower indicators.
Return Value: A list of LowerIndicator types wrapped in NSNumber that are currently set to active.
In the example application, there is sample code for creating a menu. More detailed information can be found in MainMenuViewController & MenuDataSource classes within the App Docs.
Errors
There is an error log reporter class called CWKErrorLogReporter. It is responsible for passing all error logs to a specified single delegate. You will need to set a delegate in the beginning to get the error logs.setCWKLogReporterDelegate
void: required
Parameters:
- Delegate
Description: Set the delegate used for reporting by LiveChart. Pass in NULL to remove the delegate.
stringUpperChartNoDataMessage
NSString: required
Description: Text for upper indicator no data label.
stringLowerChartNoDataMessage
NSString: required
Description: Text for lower indicator no data label.
You can also customize the error messages that the user receives when there is no data. This is located in the CWKConfiguration class.
Features
Gesture Loading
Pan
Users can pan on the app to see more data. Scroll in the direction of the orientation of the chart to pan.
Pinch and Zoom
In addition to panning, users can pinch and zoom by moving two fingers together and apart on the on the chart. This gesture causes the chart to zoom in or out.
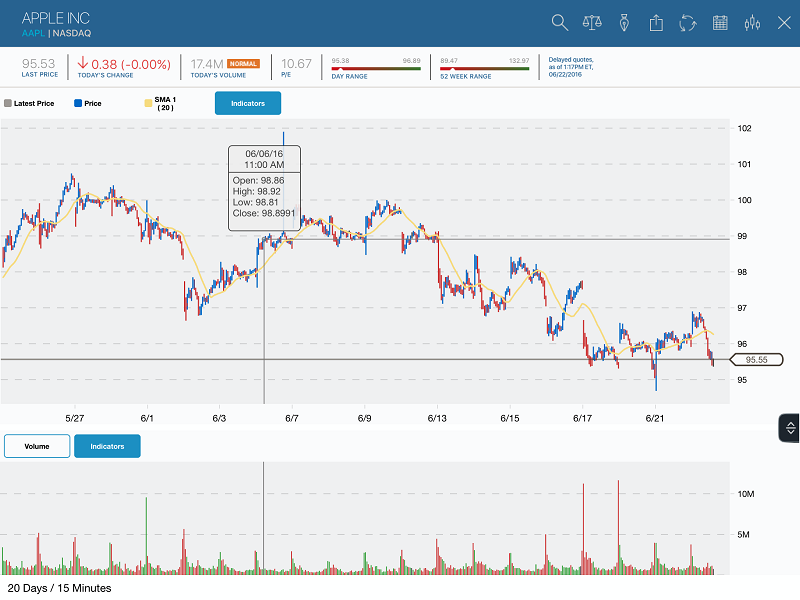
One Finger Holding
Holding one finger on the data in the chart causes the crosshair to appear which displays the date and time of the data, the open and close price and the high and low price. By tapping on the chart again, it will remove the crosshair.
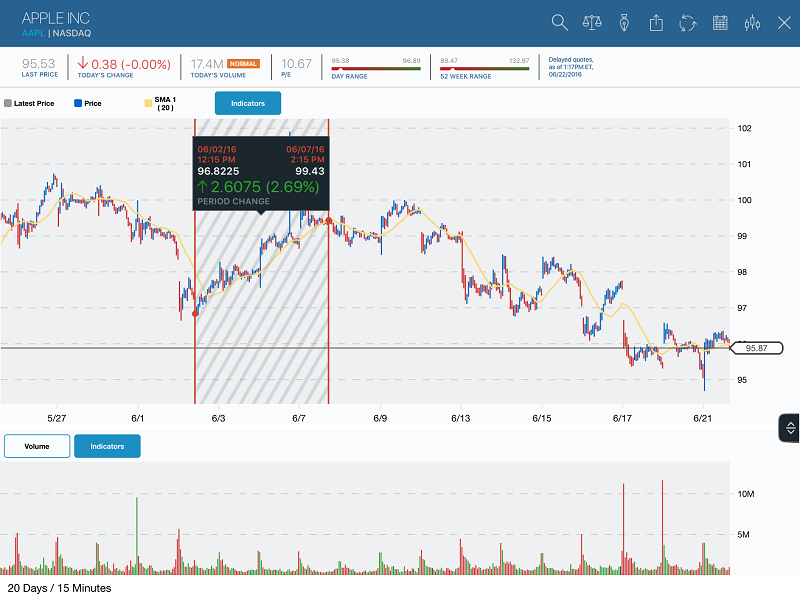
Two Finger Holding
Holding two fingers on the chart causes the period change to appear. This displays the date and time for the first and second point. It also shows the prices of each point. It also shows percent increase or decrease within the period change. By tapping on the chart again, it will remove the period change.
Crosshairs
One feature that can be enabled is a crosshair.There is a built-in crosshair but you can also implement a custom one. To create a custom crosshair, you need to disable the SDK's crosshair tooltip.enableCrossHairTooltip
boolean: required
Description: Specifies if the SDK's crosshair tooltip should be enabled. Set to NO to use a custom tooltip.
Default: YES
To change the view and style of the crosshair, go to the CWKConfiguration class in the App Docs for more details.
Styles
The look and feel of the chart view is controlled by the developers. The iOS SDK does not dictate the colors, fonts, custom buttons, and sizes of the upper & lower charts. See below for details on what can be customizable.Upper Chart Axes
The diagram below displays all of the different properties that can be customized on the upper chart axes.
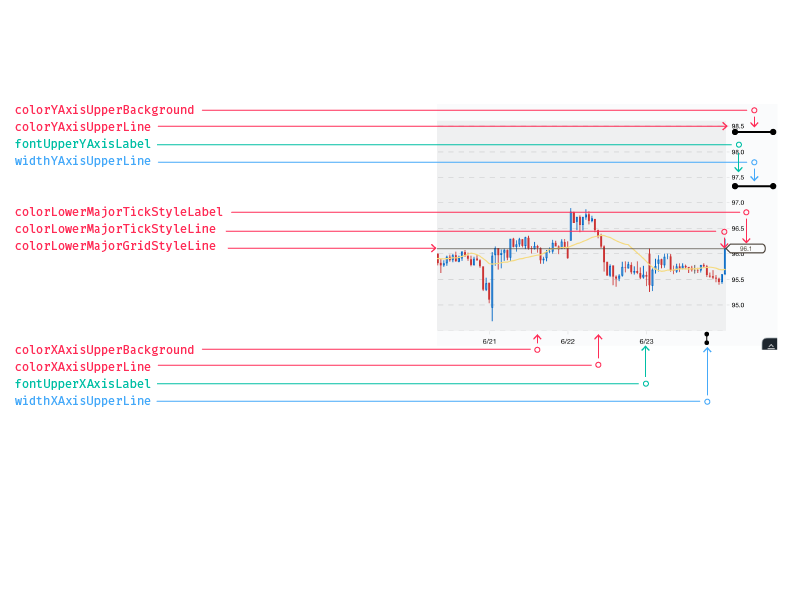
For more details, please reference the App Docs.
Lower Chart Axis
The diagram below displays all of the different properties that can be customized on the lower chart axis.
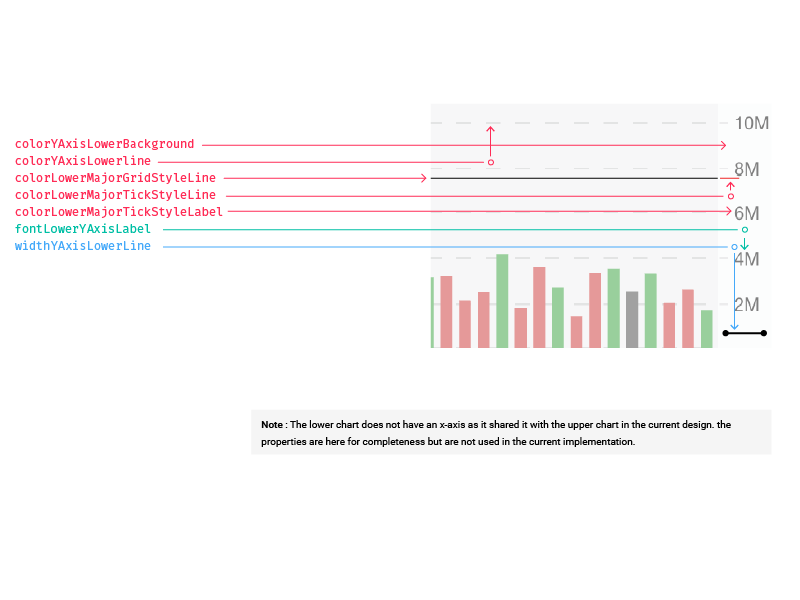
For more details, please reference the App Docs.
X-Axis Tick Labels
The X axis tick labels can be aligned in three different ways:
NSTextAlignmentLeft

NSTextAlignmentCenter

NSTextAlignmentRight

This is located under the Upper Chart Axes section within the CWKConfiguration class. The default alignment is NSTextAlignmentCenter.
Custom Timestamps
There are timestamps that can be customizable. The amount of data on the chart dictates which format is displayed. You have the freedom to edit these though.
yearFormat
Displays the year only. The default format is "Y".
Ex. 2016
monthYearFormat
Displays the month and the year together. The default format is "MMM Y".
Ex. Jun 2016
monthDayFormat
Displays the month and the day together. The default format is "M/D".
Ex. 6/23
hourMinuteFormat
Displays the hour and the minute together. The default format is "H:MM A".
Ex. 3:00 PM
monthDayYearFormat
Displays the date with the month, day, and year. It is used in the crosshair. The default format is "MM/DD/YY".
Ex. 06/23/16
Indicator Legend Buttons
The legend buttons that appear for upper and lower indicators can be configured with an image or a background color. If an image is provided it must be 75 x 20 px in size and a highlighted version of that image should be supplied or the non-highlighted image will be used for the highlighted state. If a background image is specified the background color is ignored.
imageforUpperIndicatorButton
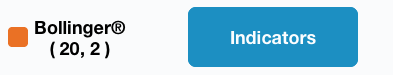
The image for the upper indicator button. There is a setting for the lower indicators as well. It is the Bollinger image in the example.
imageforUpperIndicatorButtonHighlighted
The image for the upper indicator button highlighted. There is a setting for the lower indicators as well. This is set to white (#1C8FC2FF) in the example.
fontUpperIndicatorButton
The font for the upper indicator button. This can also be set for lower indicators. It is set to Helvetica-Neue-Bold in the example.
colorUpperIndicatorButtonBackground
The color of the upper indicator button background. This is set to blue (#0067C6FF) in the example.
colorUpperIndicatorButtonHighlightedBackground
The color for the upper indicator button highlighted background. This is not displayed in the example.
Indicator Information and Parameter Settings
The diagram below shows all the different properties that can be customizable for the indicator popovers.
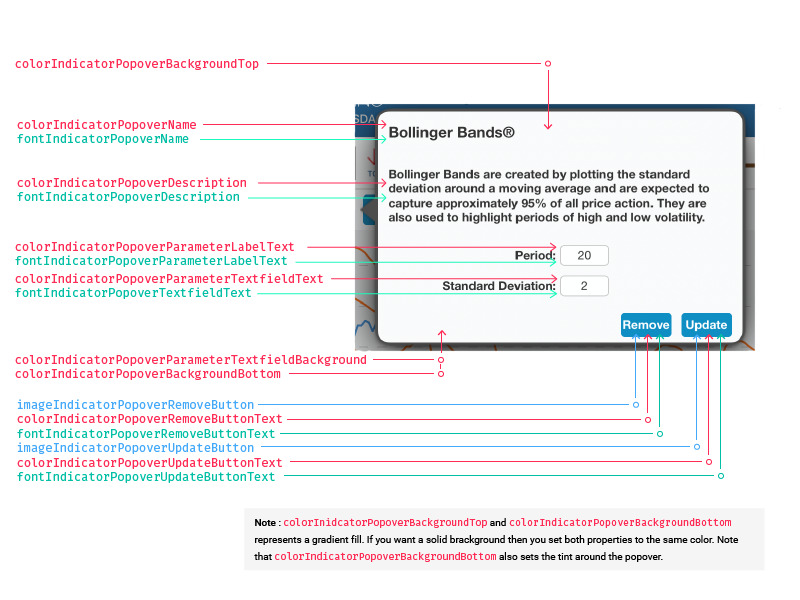
For more details, please see the App Docs.
Types of Charting
Candlestick
There are some different parameters that you can set for the candlestick style:
colorStyleCandlestickRising
The color of the rising candlesticks. It is set to blue (#0067C6FF) in the example below.
colorStyleCandlestickFalling
The color of the falling candlesticks. The example is set to red (#CC3333FF).
colorStyleCandlestickNoChange
The color of the unchanged candlesticks. It is set to gray (#444444FF) in the example.
widthStyleCandlestickOutline
The width of the candlestick outline. The example is set to 1.5.
widthStyleCandlestickStick
The width of the candlestick stick. The example is set to 1.5.

OHLC
colorStyleOHLCRising
The OHLC color for a rising segment. It is set to blue (#0067C6FF) in the example below.
colorStyleOHLCFalling
The OHLC color for a falling segment. The example is set to red (#CC3333FF).
widthStyleOHLCArm
The width of the OHLC arm. The example is set to 3.
widthStyleOHLCTrunk
The width of the OHLC trunk. The example is set to 3.

HLC
This has the same customization as OHLC.
Mountain
colorStyleMountainLine
The color of the top edge of a mountain chart. It is set to blue (#0067C6FF) in the example below.
colorStyleMountainAreaFill
The fill color of mountain charts. This is set to a lighter shade of blue (#0067C666) in the example below.
colorStyleMountainAreaFillTwo
The bottom fill color of mountain charts for gradient fill, used if mountainChartsUseGradient is enabled. The example is set to red (#CC3333FF).
mountainChartsUseGradient
If enabled, mountain charts will use a gradient with the top fill color being colorStyleMountainAreaFill and the bottom fill color being colorStyleMountainAreaFillTwo. See example below.
Line
colorStyleLine
The color for line charts. It is set to blue (#0067C6FF) in the example below.
Bar Graph
colorStyleBar
The color bar price charts. The example is set to blue (#0067C6FF).
Dot
colorStyleDot
The color of the dots. The example is set to blue (#0067C6FF).
radiusDot
The size of the dots. The example is set to 5.
Indicators
Upper Indicators Inputs
Bollinger Bands
- Period (int)
- Standard Deviation (int)
Dividends
- None
Exponential Moving Average (EMA)
- Period (int)
Linear Regression
- None
Moving Average Envelope (MAE)
- Period (int)
- Percent (int)
Price High & Low
- None
Price Channel
- Period (int)
Parabolic Stop and Reversal (PSAR)
- Initial Position (int)
- Acceleration Increase (double)
- Acceleration Maximum (double)
Simple Moving Average (SMA)
- Period (int)
Splits
- None
Time Series Forecast (TSF)
- Period (int)
Weighted Moving Average (WMA)
- Period (int)
Lower Indicators Inputs
Accumulation Distribution
- None
Average True Range (ATR)
- Period (int)
Chaikin's Volatility
- EMA Period (int)
- Difference Period (int)
Dividend Yield
- None
Directional Movement Index (DMI)
- Period (int)
Historical Dividend
- None
Moving Average Convergence-Divergence (MACD)
- Fast points (int)
- Slow points (int)
- Smoothing (int)
Mass Index
- Period (int)
- Setup Line (int)
- Trigger Line (double)
Momentum
- Period (int)
Money Flow
- None
Money Flow Index
- Period (int)
On Balance Volume
- None
Price Rate of Change (PROC)
- Period (int)
Relative Strength Index (RSI)
- Period
Rolling Dividend Yield
- None
Fast Stochastics
- Period 1 (int)
- Period 2 (int)
- Smoothing (int)
Slow Stochastics
- Period 1 (int)
- Period 2 (int)
- Smoothing (int)
Ultimate Oscillator (ULT OSC)
- Period 1 (int)
- Period 2 (int)
- Period 3 (int)
- Factor 1 (int)
- Factor 2 (int)
- Factor 3 (int)
Volume
- None
Volume Rate of Change
- Period (int)
Williams %R
- Period (int)
For more detailed information, go to the App Docs.
Zoom In/Out
The user can zoom in/out by using their fingers to pinch or expand the chart. The chart within the app will scroll with the page. You can make the chart non-interactive by setting:chartView.userInteractionEnabled = NO;
More detailed information can be found in the CWKConfiguration class within the App Docs.
Custom Events
Use this method to add an announcement to the upper chart. The announcement will be placed over the line at the passed date. Tapping the announcement will call the delegate'sannouncementTapped: method. If description is not nil, tapping the announcement will show a popover with the description. This is an example of the inputs needed to add an announcement:
In Objective-C,
(id)addAnnouncement:(NSDate *)date
              title:(nullable NSString *)title
   announcementText:(nullable NSString *)announcementText
        borderColor:(nullable UIColor *)borderColor
          fillColor:(nullable UIColor *)fillColor
          fontColor:(nullable UIColor *)fontColor
              image:(nullable UIImage *)image;
There are also other methods like remove an announcement or remove all announcements. These methods can be found in CWKView class.
Tools/Annotation
With v 3.0, we have added Annotations to the charts.Annotation Types
Lines:
- AnnotationTypeTrendline
- AnnotationTypeArrowLine
- AnnotationTypeRayLine
- AnnotationTypeExtendedLine
- AnnotationTypeGannFan
Shapes
- AnnotationTypeEllipse
- AnnotationTypeRectangle
Fibonacci
- AnnotationTypeFibonacciRetracement
- AnnotationTypeFibonacciArc
- AnnotationTypeFibonacciCircle
Other
- AnnotationTypeHorizontalLine
- AnnotationTypeText
startAnnotationModeForType
Enables the annotation drawing mode where the user can draw an annotation of the specified type on the chart.
endAnnotationMode
Ends annotation drawing mode so the user can interact with the chart again.
removeAnnotation
Removes a specified annotation of the specified type from the chart.
removeAllAnnotationsForType
Removes all the annotations of the specified type from the chart.
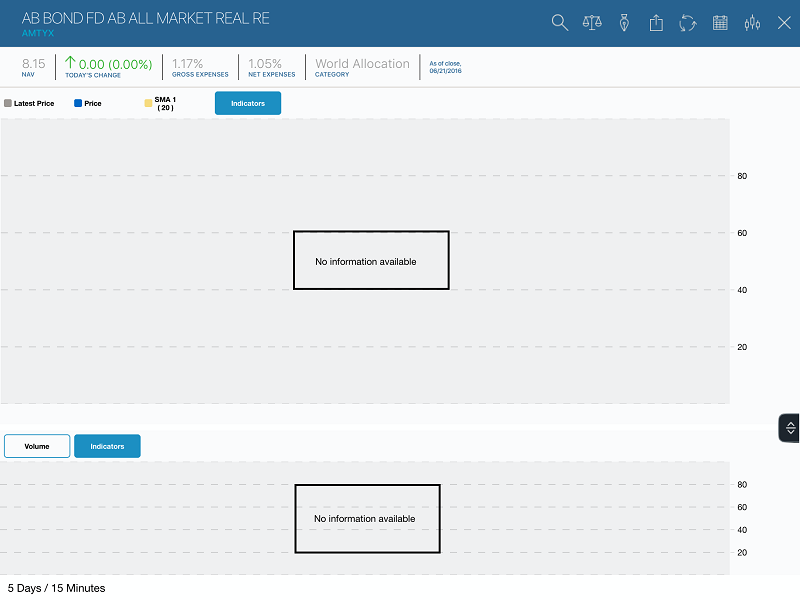
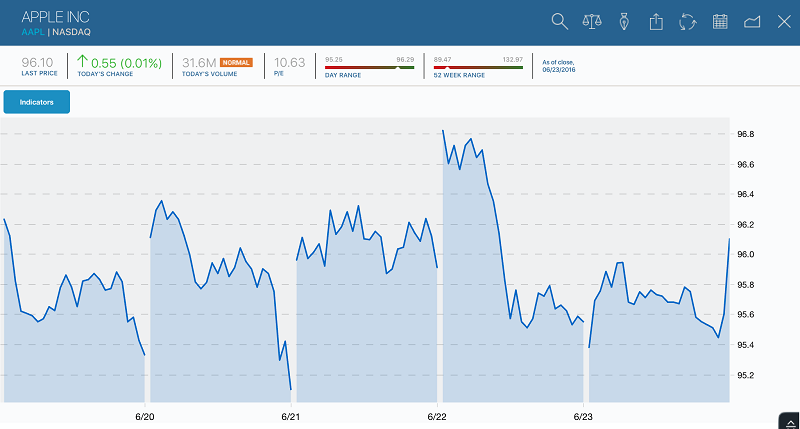
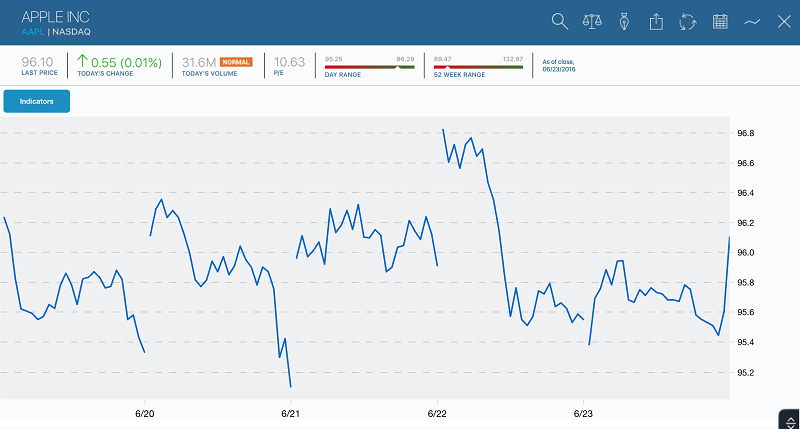
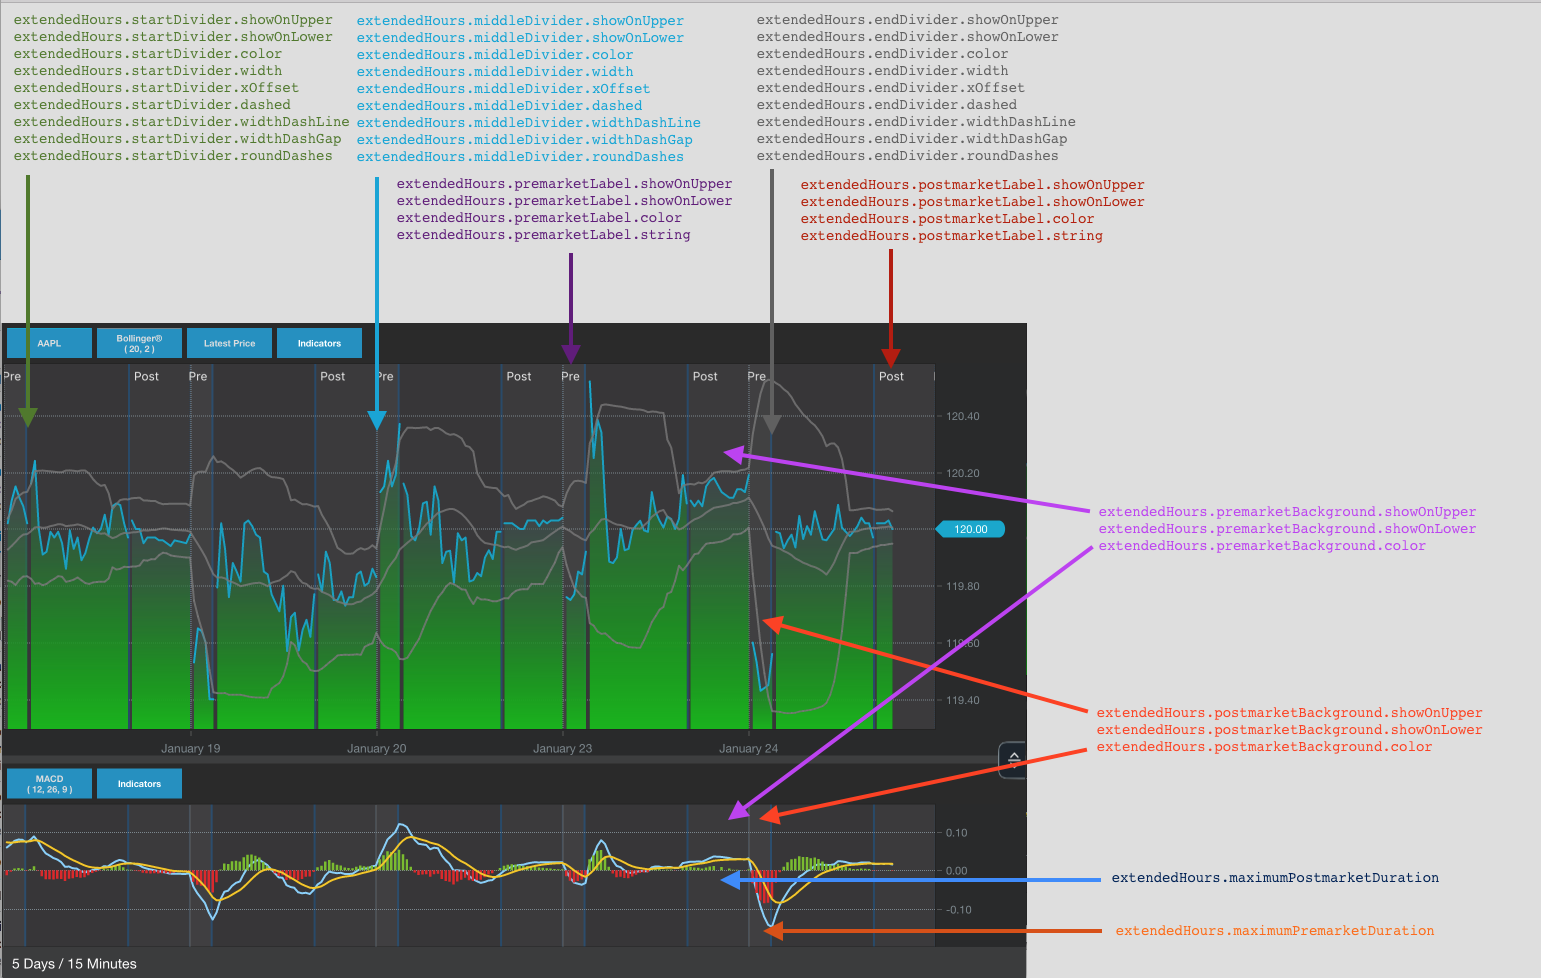
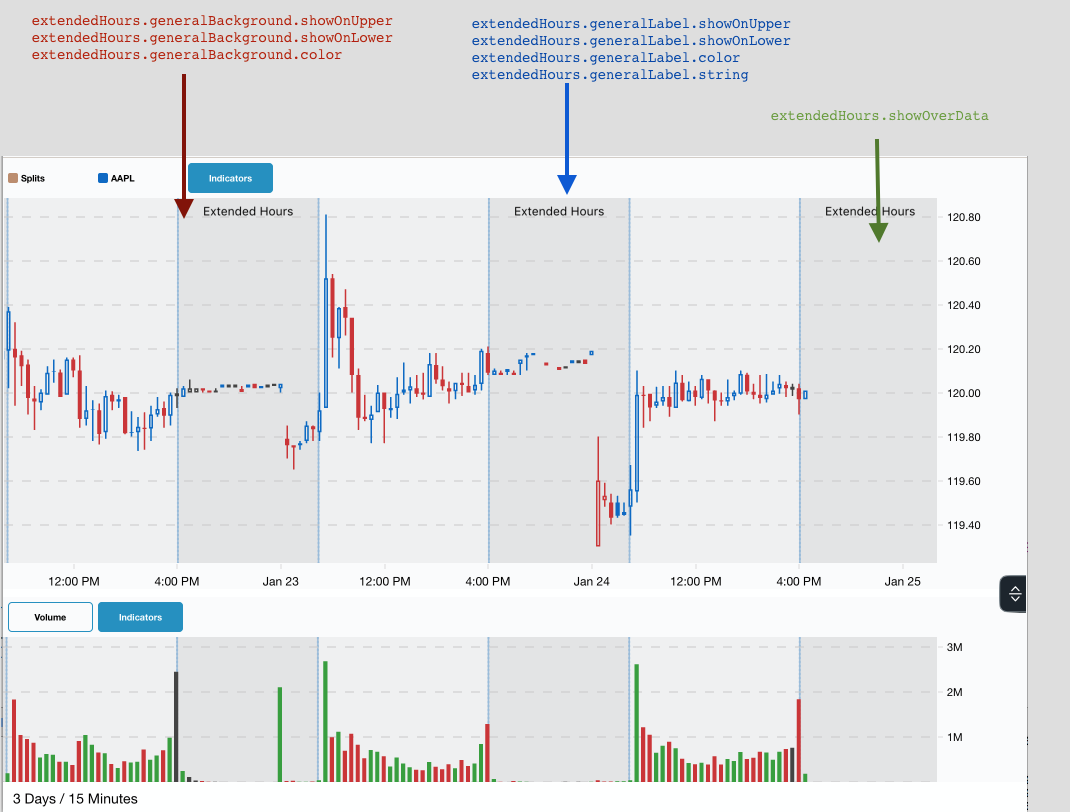
Extended Hours
To enable extended hours, use the extendedHours property on the chart
In Objective-C,
_chart.extendedHours = YES;
In Swift,
chart.extendedHours = true
There are numerous properties to configure how the extended hours appear. Extended hours can be overlaid with shading, include text above, or show a vertical divider between normal hours and extended hours. Configuration options can apply to the whole extended hours period or pre- and post-market separately. To see an example of this, you can look at the Demo app Dark (separate segments) vs Light theme (single segment).
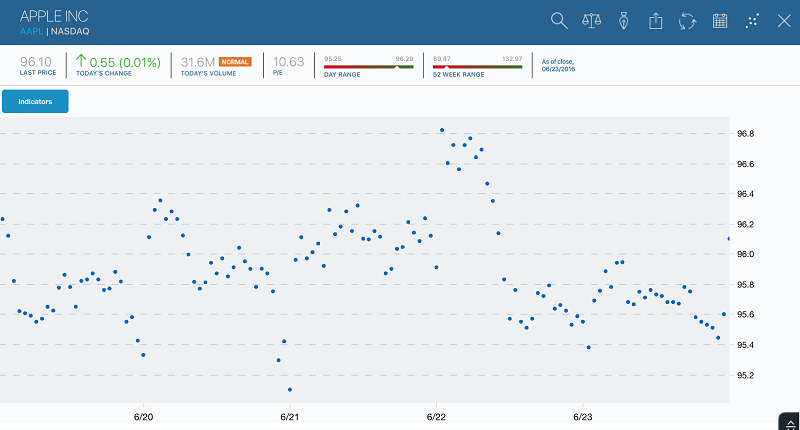
See the images below:
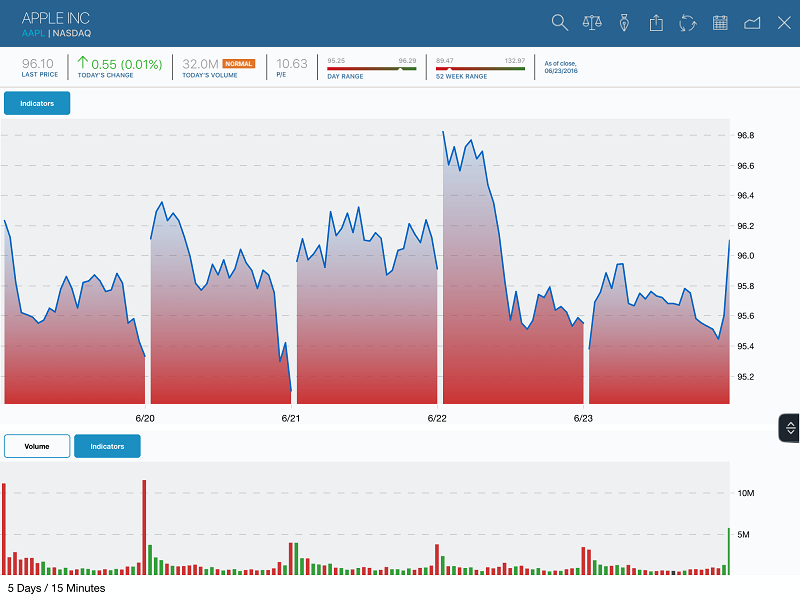
Lower Chart Overlays
Lower Chart overlays can be added programmatically or use the built in menu with the indicator popovers.
In Objective-C,
[_chart setLowerIndicatorActive:CWKLowerIndicatorVolume];
[_chart setOverlayIndicatorActive:CWKUpperIndicatorSMAFirst onLowerIndicator:CWKLowerIndicatorVolume];
In Swift,
chart.setLowerIndicatorActive(.volume)
chart.setOverlayIndicatorActive(.smaFirst, on: .volume)
The built in option can also be disabled by setting the configuration property 'disableAddOverlayButton'
Frequently Asked Questions
Q: Where is the separation between what the SDK framework provides and what a client's development team must provide?
A: The SDK will provide the complete workflow for everything that is inside the chart. The buttons around the chart that change the scale or allow the entry of a symbol is treated separately from the SDK and thus can be customized by the clients for their own needs.
Q: Does that mean that a client developer cannot change the underlying button images that is within the chart?
A: No. The CWKConfiguration class provides a UIImage property that can be set.
Q: Is there any third party technology that the SDK depends on?
A: Yes. The SDK currently leverages both open source and proprietary technologies.
Q: Is the source code available for the ChartworksKit framework?
A: Markit will provide the framework headers, library, sample library and documentation that can be used to add ChartworksKit to a client application. At this time, source code for the actual framework is not provided.
Q: Who handles the support should an issue arise while using the ChartworksKit framework or any of its underlying technologies?
A: Markit will provide support. It is not necessary to work directly with any third party vendor.
For more details on the iOS SDK, please visit the App Docs.
Change Log
v3.1.0 (current stable)
Released April 2017
New Features:
Extended Hours: You can now see trading data outside of normal trading hours.
- Limited to equities on US exchanges only
- Style options including: divider lines, shading, text, or just the data
Lower Chart Overlays: Lower indicators now support overlays including:
- Linear Regression
- Simple Moving Average (SMA)
- Exponential Moving Average (EMA)
- Weighted Moving Average (WMA)
- Moving Average Envelope (MAE)
- Bollinger Bands
Improvements / Changes:
Linear Regression will now update with the data that is on the screen
- As you pan and scroll the linear regression will recalculate using the data on the screen
- This also applies to linear regression used in overlays
Annotations will now normalize along with the chart
- When switching from price to percent for the Y-Axis, annotations will switch as well
The original -getChartSettings method has been replaced and there are now more options when saving a chart
- -getChartSettingsForTemplate is intended to save a user's preferences
- -getChartSettingsForSave saves an exact chart
- -getChartSettingsWithOptions lets you specify exactly which parts of a chart's settings to save
Bug Fixes
- Improve candlestick appearance when using some symbols, especially XAO in Australia
- Reduced white space surrounding lower chart annotations.
v3.0.0
Released October 2016
New Name:
The interactive charting SDK is now called ChartworksKit. Learn more at Chartworks.io!
New Features:
- Gesture Based Annotation Editing
- New Upper Indicator: Volume By Price
- New Annotations:
- Fibonacci Arc & Circle
- Fibonacci Retracement has been enhanced with more options, and fill shading
- Gann Fan
- Ray Line
- Extended Line
- Arrow Line
- Level Line
- Horizontal Line + Text
- Ellipse
- Rectangle
- Text
Improvements / Changes:
- New properties to control indicator line widths
- Updated version of ShinobiCharts which includes stability and performance improvements
Breaking Changes
Renamed Files
| Old File Name | New File Name |
|---|---|
| LiveCharts.framework | ChartworksKit.framework |
| LiveCharts.bundle | ChartworksKit.bundle |
| import LiveCharts | import ChartworksKit |
| #import |
#import |
| MarkitChartsVersion.h | CWKVersion.h |
| LChartView.h | CWKView.h |
Renamed Types
| Old Type Prefix | New Type Prefix |
|---|---|
| LChartLogReporter | CWKErrorReporter |
| LChart | CWK |
| LC | CWK |
| UpperIndicator | CWKUpperIndicator |
| LowerIndicator | CWKLowerIndicator |
| DurationAmount | CWKDuration |
Method Changes
Network Completion Blocks
In order to properly handle responses from the server, the NSURLResponse object must be returned be performing a network request. This affects clients that want to do their own networking. OLD:
- (void)chartView:(LChartView )chartView performNetworkOperationForURL:(NSURLRequest )request onCompletion:(nullable void (^)(NSData _Nullable jsonData, NSError _Nullable error))onCompletion; NEW:
- (void)chartView:(CWKView )chartView performNetworkOperationForURL:(NSURLRequest )request onCompletion:(CWKNetworkCompletion)onCompletion;
Requires Shinobi 2.8.7-3
v2.2.9
Released September 1st, 2016
Improvements / Changes:
- When automatically replacing price text with the base symbol, change now takes place sooner
- Add ability to disable legend interaction. See LChartConfiguration properties: indicatorUpperButtonBarInteractionEnabled & indicatorLowerButtonBarInteractionEnabled
Bug Fixes:
- Fix issue where configuration colors might be cached incorrectly when using multiple charts
Requires Shinobi 2.8.5-3
v2.2.8
Released August 29th, 2016
Improvements / Changes:
- Price text can automatically be replaced with the base symbol. See -[LChartConfiguration showDisplaySymbolInLegendInsteadOfNameShortPrice]
Bug Fixes:
- Fix crash that could occur on January 1st when loading a YTD chart initially
- Fix bug where legend might be larger than needed (room for an additional button below was created)
- Fix bug where first candlestick color could be incorrect
- Fix demo app issue which could cause all indicators to be loaded
- Fix demo Swift app casting error
Requires Shinobi 2.8.5-3
v2.2.7
Released August 4th, 2016
Bug Fixes:
- Fix issue where stepped series (EG: Revenues) sometimes wouldn't appear on short term charts
- Fixed Y-Axis scale getting misconfigured after modifying comparisons/indicators
- Updated Symbol Lookup Framework with fix for NSNumber in NSString property of MKTSLTypeaheadSymbol
- Fixed lower chart reappearing after a reload
- Fixed a possible crash in Demo app
- Fixed an issue in Demo app where comparison color was overridden.
Requires Shinobi 2.8.5-3
v2.2.6
Released July 21st, 2016
Improvements / Changes:
- Updated Symbol Lookup Framework with support for Typeahead and Translation requests
- By default, when disabling all lower indicators, the lower chart is hidden. See the -[LChartConfiguration hideLowerChartWhenNoLowerIndicatorIsActive]
Requires Shinobi 2.8.5-3
v2.2.5
Released July 19th, 2016
Improvements / Changes:
- Support for DataInterface added, this allow announced earnings with a compatible API
- Dash pattern width can be adjusted for chart gridlines
Bug Fixes:
- Fixed an issue where using a non-centered tick label on the X-Axis could be misaligned.
Requires Shinobi 2.8.5-3
v2.2.4
Released July 13th, 2016
Improvements / Changes:
- Symbol Info API is optional
Bug Fixes:
- Fixed issue where Y-Axis tick mark labels could be clipped by the legend
- Fixed issue where X-Axis tick mark labels might be too narrow
Requires Shinobi 2.8.5-3
v2.2.3
Released July 12th, 2016
Improvements / Changes:
- Support for authenticated APIs added
Bug Fixes:
- Returns calculator could show incorrect data when dragged of edge of chart data
- Returns calculator was positioned slightly off-center
- Crash fix: Returns calculator could sometimes cause a crash
- Crash fix: NSDateFormatter would sometimes not return a date when parsing chart data
- Crash fix: When resetting chart, buildChartRequest: could sometimes cause an infinite loop
- Y-Axis Labels for symbols in comparison without data are now hidden
- Possible to request no lower indicator without chart defaulting to showing volume
Requires Shinobi 2.8.5-3
v2.2.2
Released June 8th, 2016
Bug Fixes:
- Fixes a crash when switching between some timeframes to a timeframe that does not have data
Requires Shinobi 2.8.5-3
v2.2.1
Released May 27, 2016
Bug Fixes:
- Chart now allows no lower chart indicator to be selected without defaulting to Volume
Requires Shinobi 2.8.1-3
v2.2.0
Released April 21, 2016
New Features:
- Automatic switching of frequency based on zoom
- Add support for top/bottom hugging event annotations (MC-1288)
Improvements / Changes:
- Ability to disable comparison y-axis labels (MC-1273)
- Update Shinobi Charts to 2.8.5-3 to address some crashes (MC-1227)
- Add more timeframes and frequencies (MC-1278)
- The Latest Price indicator can now track the rightmost data point similar to comparison labels (MOBMC-50)
- Automatic y-axis scaling for the lower chart (MOBMC-32)
Bug Fixes:
- Disabling then immediately re-enabling an indicator should no longer trigger a network request (MOBMC-49)
- Fix some issues with 24 hour exchanges (MC-445)
Requires Shinobi 2.8.1-3
v2.1.2b-j
Released January 14 - February 10, 2016
New Features:
- Added a network timeout property, so that requests will fail if not returned in a given amount of time
- Added the ability to provide a custom view for the returns calculator
Improvements / Changes:
- SymbolLookup updates
- Removed limit on comparisons
- Indicator popovers are now scrollable, in case the height is constrained and not all the content is visible
Bug Fixes:
- Fixed an issue where returns calculator would hug left leg
- Fixed an issue candlesticks market close and open were farther apart then necessary
- Fixed a crash that could happen when tapping the indicator button on iOS 8
- Fixed an issue where event popup details popup became misplaced after rotation
- Fixed an issue where returns calculator would close after rotation
- Fixed an issue where crosshair and returns calculator would both be visible
- Fixed an issue where the user could pan existing data off the screen
Requires Shinobi 2.8.1-3
v2.1.3
Released December 11, 2015
Improvements / Changes:
- Add ability to completely hide indicator area through two new configuration properties: indicatorUpperButtonBarShown and indicatorLowerButtonBarShown. (MC-1368)
- Added mountain gradient support by adding new properties configuration properties: mountainChartsUseGradient and colorStyleMountainAreaFillTwo (MC-1359)
- Added a method to clear all chart data. -[LChartView resetCharts] (MC-1363)
- New configuration property to disable format string localization to get precise format strings. -[LChartConfiguration shouldLocalizeDateFormats] (MC-1369)
- Nullability Annotations and Generics have been added to the header files to help use with Swift. (MC-1371)
Bug Fixes:
- Fixed a crash with incredibly small charts (MC-1360)
- Fixed issue where the delegate callback chartView:didFinishLoading: was called twice (MC-1361)
- Fixed an issue where the axis background color could be misaligned (MC-1373)
Requires Shinobi 2.8.1-3
v2.1.2
Released November 30, 2015
Improvements / Changes:
- Changes made to support symbol lookup integration. -[LCSecuritySymbol symbolName] has been renamed to ‘symbol’. An issueId is required to be set on the LCSecuritySymbols passed to the chart.
Requires Shinobi 2.8.1-3
v2.1.1
Released October 30, 2015
Bug Fixes:
- Fix issue where network request could be triggered if chart was created before the app was active.
- Fix Fibonacci retracement order
Requires Shinobi 2.8.1-3
v2.1.0
Released October 19, 2015
New Features:
- New annotation: Fibonacci retracement (MC-1194)
- Chart display: added y-axis chart labels for comparisons (MC-1209)
- Gesture option: pinching and holding the chart will load a longer duration chart (MC-1166)
- Gesture option: zooming into a chart with a lower frequency will trigger the load of a more detailed chart (MC-1129)
Improvements / Changes:
- Customization: client apps can now implement an independent crosshair display (MC-1124)
- Legend option: indicator parameter values are now shown in the legend (MC-975)
- Timezone option: client apps can now disable timezone normalization (MC-445)
- Axis labeling: improved y-axis tick mark labeling by allowing 2 to be a potential multiplier (MC-1097)
- Indicator display: revenues and rolling EPS indicators now extend to the left edge of the chart (MC-1100)
Bug Fixes:
- Text update: fix incorrect default P/E ratio indicator legend button text (MC-998)
- Chart display: zoom no longer resets on rotate (MC-533)
- Chart display: zoom is preserved when adding or removing an indicator (MC-1163)
Requires Shinobi 2.8.1-3
v2.0.0
Released June 26, 2015
New Features:
- All-new server API (MC-460)
- Dynamically load more data when panning (MC-95)
- Allow LChartConfiguration to be configured using XML file, which can be shared between platforms (MC-466)
- Move localization strings into XML
- Y-Axis rescales as chart is panned and zoomed (MC-349)
- Several new Fundamentals indicators (MC-535)
- Returns Calculator to show change between two points on the chart (MC-604)
- Trendline annotations
- Save screenshots of charts
- Save/load some chart settings (MC-712)
- Extend crosshair line to other chart (MC-542)
- Allow only specified indicators to be loaded from the server API
Improvements / Changes:
- X-Axis built using market exchange data (MC-88)
- Added, modified, and renamed several properties in LChartConfiguration
- Chart will return error if API returns only one data point for base symbol
Bug Fixes:
- Fix X-Axis values for securities with Sparse data
- Fix incorrect Y-Axis values on some lower indicators
- Fix crashes involving OpenGL calls while app is backgrounded (MC-974)
Requires Shinobi 2.8.1-3